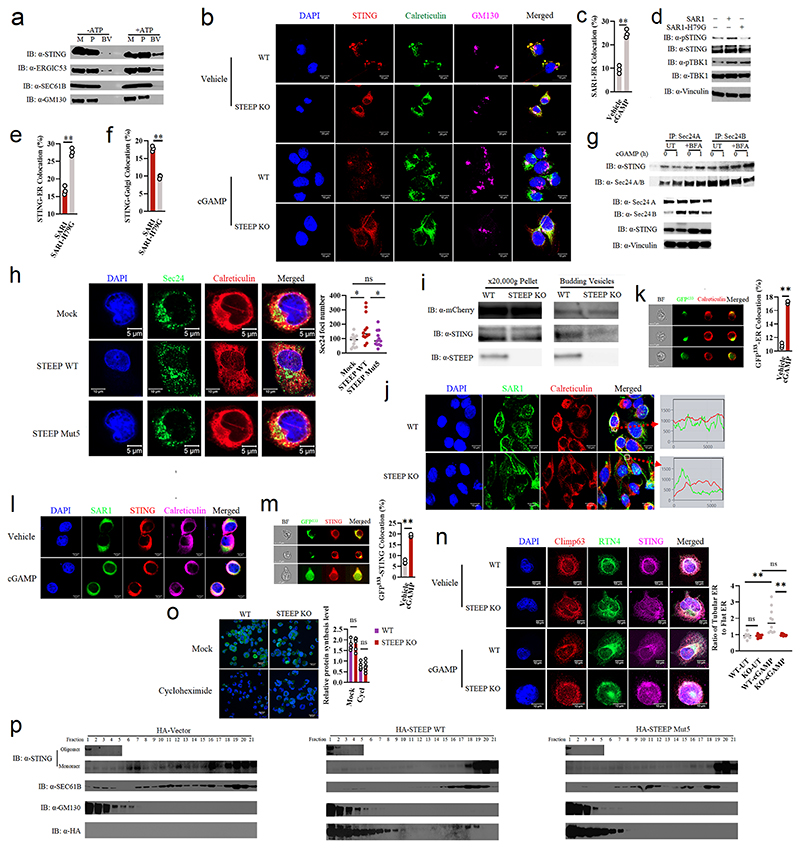
Extended Data Fig. 5. Impact of STEEP on STING trafficking.
(a) The in vitro membrane budding reaction illustrated in Fig. 4a was performed with material from wild-type THP-1 cells in the presence or absence of ATP. M, membranes; P, post 20.000 g pellet; BV, budding vesicles. Representative blots from three biologically independent experiments with similar results are shown. (b) Confocal microscopy of WT Hela and STEEP KO Hela cells stimulated with/without cGAMP for 0.5 h. The cells were immunostained with anti-STING (red), anti-calreticulin (green), anti-GM130 (purple). Sections were counterstained with DAPI to visualize nuclei. (n = 3 biologically independent experiments). (c) ImageStream analysis of Sar1-ER colocation. FLAG-tagged Sar1 was transfected into HEK-293T with STING expression cells for 24 h, and stimulated with/without cGAMP (100 nM) for 30 min. After fixation and permeabilization, the cells were incubated with rabbit anti-calreticulin (ER marker) and mouse anti-FLAG. (n = 3) (**P = 0.00042). (d) Immunoblot analysis of the indicated proteins from the whole Hela cell lysates transfected with SAR1 or SAR1-H79G. (n = 3 biologically independent experiments). (e, f) Imagestream analysis of STING trafficking from ER (e) to Golgi (f) after transfection of SAR1 or SAR1-H79G for 24 h in HEK-293T with STING expression cells (e, **P = 0.00035; f, **P = 0.00010). (g) Endogenous Sec24 was immunoprecipitated from THP-1 cell lysates isolated after +/-BFA treatment and cGAMP (100 nM) stimulation for the indicated time. Precipitates and lysates were immunoblotted with antibodies against Sec24A/B, STING, and vinculin (n = 3 biologically independent experiments). (h) Confocal microscopy analysis of Sec24 foci in STEEP KO THP-1 cells rescued with WT or mut5 STEEP mRNA and stimulated with cGAMP for 10 min. Nuclei were stained with DAPI. For quantification of Sec24 foci, 12 cells per group were counted in a blinded fashion. Representative data from one experiment are shown (n = 3 biologically independent experiments). Each data point represents one cell and data are shown as means +/- st.dev. Statistical analysis was performed by a two-tailed unpaired t test with welch’s correction (*P = 0.016, ns P = 0.51, *P = 0.045, left to right). (i) Budding vesicle analysis (as illustrated in Fig 4a) for mCherry-VSVG and STING on WT and STEEP KO Hela cells transfected with mCherry-VSVG. The data shown is representative from two biologically independent experiments with similar results. (j) Confocal microscopy imaging of SAR1-Flag (green) and calreticulin (red, ER marker) in WT and STEEP KO Hela cells stimulated with cGAMP (100 nM) for 20 min. Sections were counterstained with DAPI to visualize nuclei. (n = 3 biologically independent experiments). (k) Imagestream analysis of ER membrane curvature in Flag-STING-transfected HEK-293T cells probed with GFP133 with/without 100 nM cGAMP stimulation for 20 min. (n = 3) (**P = 0.000011). (l) Confocal microscopy analysis Hela cells transfected with Flag-tagged STING and GFP133 and treated with 100 nM cGAMP stimulation for 20 min. Cells were probed with antibodies against of STING (Red) and Calreticulin (ER marker, Purple). GFP133 (green) is an ER membrane curvature probe. (n = 3 biologically independent experiments). (m) Imagestream analysis of ER membrane curvature and STING colocation in HEK-293T cells with/without 100 nM cGAMP stimulation for 20 min. (n = 3) (**P = 0.000044). (n) WT and STEEP KO THP-1 cells were stimulated with cGAMP for 10 min, fixed and stained with anti-Clim63, anti-RTN4, and anti-STING. Nuclei were stained with DAPI. For quantification of RTN4:Climp63 ratio, 10 cells per group were counted in a blinded fashion. Representative data from one experiment are shown (n = 3 biologically independent experiments). Each data point represents one cell and data are shown as means +/- st.dev. Statistical analysis was performed by a two-tailed unpaired t test with welch’s correction (ns P = 0.64, **P = 0.0046, **P = 0.0060, ns P = 0.071). (o) Analysis of protein synthesis in WT and STEEP KO THP-1 cells using the Click-iT™ HPG Alexa Fluor™ 488 Protein Synthesis Assay Kit (n = 6) (ns P = 0.62, ns P = 0.10, left to right). (p) ER- and Golgi-enriched pellets from lysates of STEEP-deficient Hela cells transfected with empty vector, HA-STEEP WT, or HA-STEEP mut5 were fractionated by gradient centrifugation. The collected fractions were immunoblotted with anti-STING, anti-HA, anti-GM130 (Golgi), and anti-Sec61B (ER). Representative blots from one experiment are shown (n = 3). For data from ImageStream analysis (panel c, e, f, k, and m), each data point represents the percent of positive cells from one representative sample and are shown as means +/- st.dev. Statistical analysis of data in panels c, e, f, k, m, and o was performed using two-tailed Student’s t-test.

