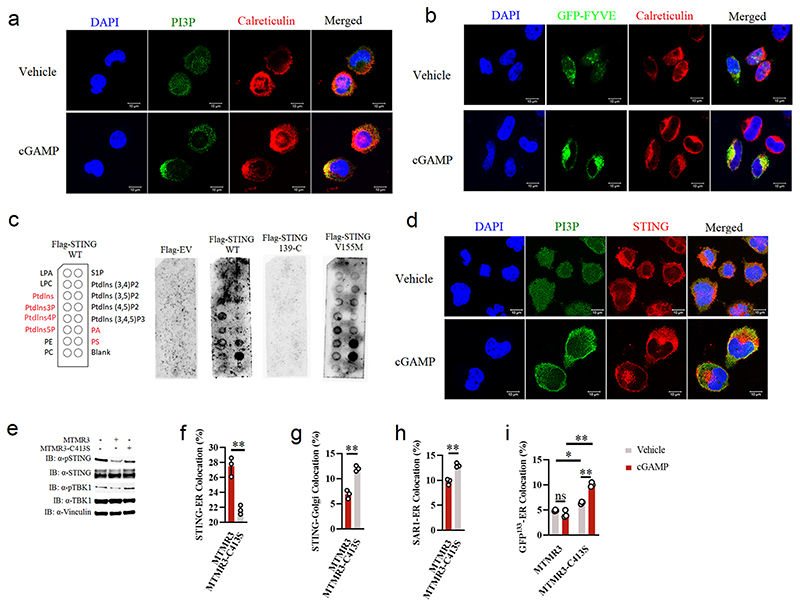
Extended Data Fig. 6. STEEP promotes PI3P production and ER membrane curvature.
(a, b) Confocal microscopy analysis of PI3P level on ER. PI3P was probed with anti-PI3P antibody in THP-1 cells (a), or FYVE-GFP in Hela cells (b) or with/without 100 nM cGAMP stimulation for 20min. ER was stained and visualized using rabbit anti-Calreticulin (ER marker, Red) and mouse anti-flag, and relevant secondary antibodies. (c) PIP Strip membranes blotted with various lipids were incubated sequentially with Flag-tagged WT, 139-C, or V155M STING or with empty vector (EV). An anti-Flag antibody conjugated with HRP was used to visualize the binding. Phospholipids with clear positive binding to WT STING are highlighted in red on the left PIP Strip illustration. (d) Confocal analysis for the colocation of anti-STING and anti-PI3P antibodies in THP-1 cells with/without 100 nM cGAMP stimulation for 15 min. (e) Immunoblot analysis of the indicated proteins from the whole cell lysates of Hela cells transfected MTMR3/MTMR3-C143S, and stimulated for 1h with cGAMP. (n = 3 biologically independent experiments). (f, g) Imagestream analysis of STING trafficking from ER (f) to Golgi (g). HEK-293T cells were transfected by MTMR3/MTMR3-C143S and Flag-tagged STING for 24 h and stimulated cGAMP (150 nM) for 30 min. After fixation and permeabilization, flag and ER were labelled using rabbit anti-calreticulin (ER marker) and mouse anti-flag, and relevant secondary antibodies. (n = 3) (f, **P = 0.0020; g, **P = 0.00088). (h) Imagestream analysis of SAR1-ER colocation. Hela cells were transfected by MTMR3/MTMR3-C143S and Flag-tagged SAR1 for 24 h and stimulated cGAMP (100 nM) for 30 min. After fixation and pre-permeabilization, ER and Flag were labelled using rabbit anti-calreticulin (ER marker) and mouse anti-flag, and relevant secondary antibodies. (n = 3) (**P = 0.0014). (i) Imagestream analysis of ER membrane curvature. HEK cells were co-transfected by MTMR3/MTMR3-C143S, Flag-tagged STING and GFP133 for 24 h and stimulated with/without cGAMP for 30 min. After fixation and pre-permeabilization, the cells were stained with anti-calreticulin and relevant secondary antibodies. (n = 3) (ns P = 0.26, *P = 0.012, **P = 4.3E-05, **P = 1.0E-06, left to right). Panels a-e, representative images from n = 3 biologically independent experiments with at least 2 times similar results are shown. For data from ImageStream analysis (panel f, g, h, i), each data point represents the percent of positive cells from one representative sample and are shown as means +/- st.dev. Statistical analysis of data in panels f-h was performed using two-tailed Student’s t-test, and in panel i was performed using two-tailed one-way ANOVA test.

