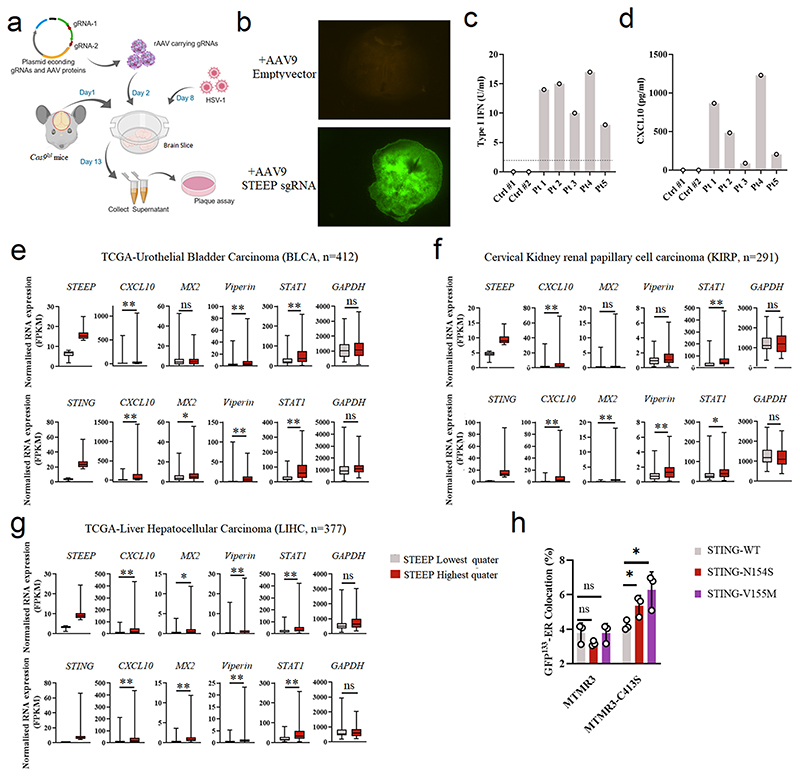
Extended Data Fig. 8. Role for STEEP in host defense and inflammation.
(a) The workflow for examination of HSV1 replication in genome-edited brain slices from Cas9lsl mice. (b) To evaluate expression from the Cas9 and GFP-containing locus, emission of fluorescence from AAV9-treated Cas9lsl brain slices was monitored. The images represent brain slices 6 days after treatment. Representative images from two biologically independent experiments with similar results are shown. (c-d) Levels of type I IFN bioactivity and CXCL10 protein in serum from five SLE patients and two healthy donors. (e-g) Box plots of TCGA RNA expression profiles in Bladder Urothelial Carcinoma (BLCA, e), Cervical Kidney renal papillary cell carcinoma (KIRP, f), and Liver Hepatocellular Carcinoma (LIHC, g). Samples with the highest 25% and the lowest 25% of STEEP (upper panels) and STING (lower panels) expression were selected and grouped. CXCL10, MX2, Viperin (RSAD2), STAT1 and GAPDH gene expression levels were compared between STEEP/STING-high and STEEP/STING-low groups. The upper and lower ends of the boxes represent the upper and lower quartiles, and the horizontal line inside the box is median of the dataset. The bar extending parallel from the boxes is the “whiskers”, indicating upper and lower extreme of the dataset. Statistical significance was evaluated using two-tailed Mann-Whitney test (ns P > 0.01, *P < 0.01, **P < 0.001). (h) Imagestream analysis of ER membrane curvature. HEK-293T cells were co-transfected by MTMR3/MTMR3-C143S, STING/ STING SAVI mutant and GFP133 for 24 h. After fixation and pre-permeabilization, the cells were stained with anti-calreticulin and relevant secondary antibodies. (n = 3) (ns P = 0.15, ns P = 0.10, *P = 0.038, *P = 0.029, left to right). For data from ImageStream analysis (panel h), each data point represents the percent of positive cells from one representative sample and are shown as means +/- st.dev. Statistical analysis of data panel h was performed using two-tailed Student’s t-test.

