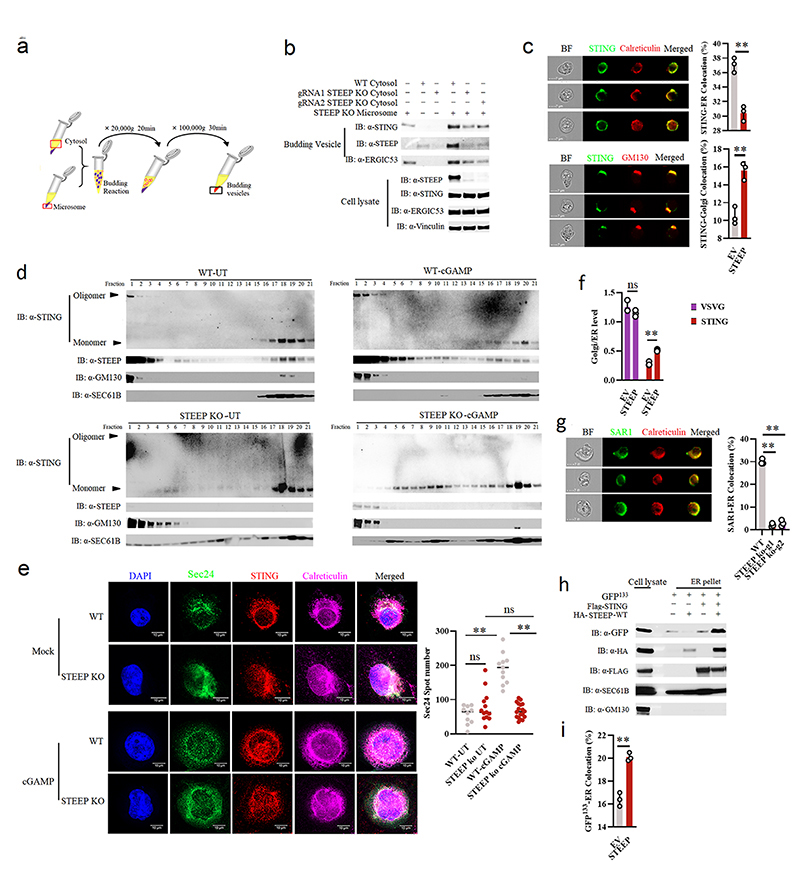
Figure 4. STEEP is essential for STING trafficking from ER to Golgi.
(a) Illustration of the in vitro membrane budding reaction. (b) Immunoblot analyses of budded material from the in vitro membrane budding reactions using cytosolic fractions from WT or STEEP-deficient THP-1 cells and microsomes from STEEP-deficient THP-1 cells. (n = 3 biologically independent experiments). (c) HEK-293T cells were transfected as indicated and probed with mouse anti-FLAG and either rabbit anti-calreticulin (ER marker) or anti-GM130 (Golgi marker). Cells were analysed by ImageStream. (n = 3) (**P = 0.0013, **P = 0.0030, up to down). (d) ER- and Golgi-enriched pellets from mock- or cGAMP-treated WT and STEEP-deficient HeLa cells were fractionated, and immunoblotted for STEEP, STING, GM130 (Golgi), and Sec61B (ER) (n = 2 biologically independent experiments). (e) WT and STEEP-deficient THP-1 cells stimulated with cGAMP for 10min were stained with anti-Sec24, anti-STING, and anti-calreticulin. For quantification of Sec24 foci, 10, 13, 11, and 18 cells from the WT-Mock, STEEP KO-Mock, WT-cGAMP, and STEEP KO-cGAMP, respectively were counted in a blinded fashion. Representative data from one experiment are shown (n = 3 biologically independent experiments). Statistical analysis used: two-tailed unpaired t test with welch’s correction. Each data point represents one cell and are shown as means +/- st.dev. (ns P = 0.15, **P < 0.000001, nsP = 0.41, **P < 0.000001, left to right). (f) HEK-293T cells transfected with STING, VSVG, and STEEP as indicated for 24 h were subjected to ImageStream analysis for colocalization of STING and VSVG with ER and Golgi. The data are shown as Golgi/ER (n = 3) (ns P = 0.18, **P = 0.00050, left to right). (g) FLAG-tagged Sar1 was transfected into WT or STEEP-deficient Hela cells for 24 h, and stimulated with cGAMP (100 nM, 30 min) Cells were probed with rabbit anti-calreticulin (ER marker) and mouse anti-FLAG. (n = 3) (**P = 0.0000040, **P = 0.000012, left to right). (h) HEK-293T cells were transfected as indicated. ER-enriched pellets precipitated with calcium chloride were immunoblotted for GFP, HA, GM130 (Golgi), and Sec61B (ER). (n = 3 biologically independent experiments). (i) GFP-tagged ALPS (GFP133) was co-transfected with the indicated vectors into HEK-293T cells for 24 h. Fixed cells were probed with rabbit anti-calveticulin (ER marker). (n = 3), and analyzed by ImageStream (**P = 0.00080). For data from ImageStream analysis (panels c, f, g, and i), each data point represents the percent of the positive cells from one representative sample and are shown as means +/- st.dev. Statistical analysis of data in panels c, f, g, and i was performed using two-tailed Student’s t-test.

