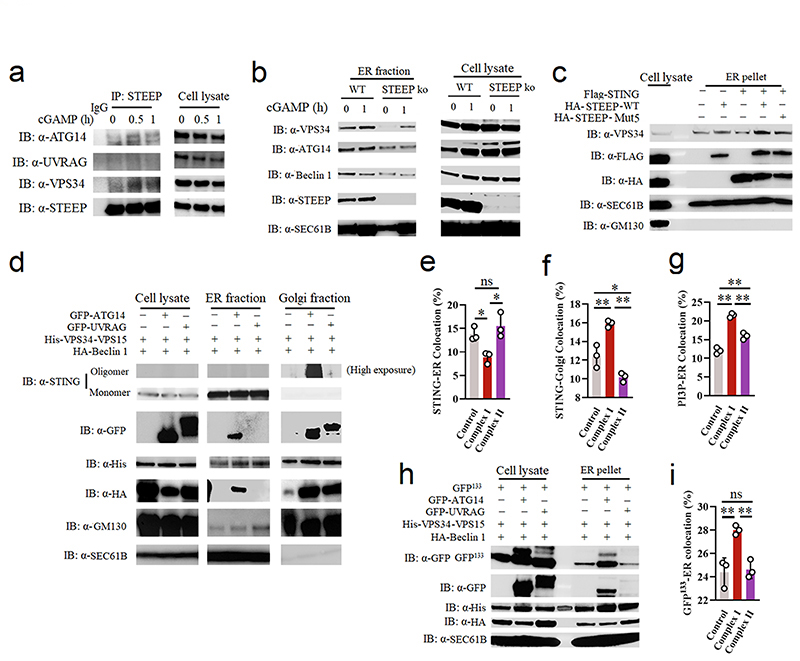
Figure 6. STEEP recruits the VPS34 complex I to ER to produce PI3P.
(a) Immunoblot analysis for the indicated proteins in anti-STEEP immunoprecipitates from THP1 cell lysates. Cells were stimulated with cGAMP (100 nM, for 0, 0.5, and 1 h). (n = 2 biologically independent experiments). (b) Immunoblot analysis of the indicated proteins from the ER fraction of THP-1 cells treated with cGAMP for 1 h. (n = 3 biologically independent experiments). (c) HEK-293T cells were transfected with Flag-STING and HA-STEEP (WT/mut5). ER-enriched pellets were immunoblotted for VPS34, FLAG, HA, GM130 (Golgi), and Sec61B (ER). (n = 3 biologically independent experiments). (d) ER- and Golgi-enriched pellets from STING-expressing HEK-293T cells transfected with control (His-VPS34, HA-Beclin1, V5-VPS15 and empty vector), Complex I (His-VPS34, HA-Beclin1, V5-VPS15 and GFP-ATG14) or Complex II (His-VPS34, HA-Beclin1, V5-VPS15 and GFP-UVRAG) were fractionated, and immunoblotted for the indicated proteins (n = 3 biologically independent experiments) (e, f) HEK-293T cells were transfected by control, Complex I, or Complex II (as specified under d above) and FLAG-tagged STING for 24 h. Fixed cells were probed with the indicated antibodies, and analyzed by ImageStream. (n = 3) (ns P = 0.54, *P < 0.05, **P = 0.01). (g) ImageStream analysis of PI3P-ER colocalization. HEK-293T cells were transfected with control, Complex I or Complex II (as specified for panel d above), GFP-FYVE and FLAG-tagged STING for 24 h. Fixed cells were probed with the indicted antibodies. (n= 3) (**P < 0.0001, **P = 0.0022, **P = 0.00030, left to right). (h) STING-expressing HEK-293T cells were transfected with GFP-tagged ALPS (GFP133), control, Complex I, or Complex II (as specified in panel d). ER-enriched pellets were immunoblotted for GFP, HA, His, GM130 (Golgi), and Sec61B (ER). (n = 3 biologically independent experiments). (i) HEK-293T cells were transfected with control, Complex I or Complex II, GFP133 and FLAG-tagged STING for 24h. Fixed cells were probed with the indicted antibodies and analyzed by ImageStream. (n = 3) (**P = 0.0053, ns P = 0.94, **P = 0.0074, left to right). For data from ImageStream analysis (panels e, f, g, and i), each data point represents the percent of the positive cells from one representative sample and are shown as means +/- st.dev. Statistical analysis of data in panels e, f, g, and i was performed by two-tailed one-way ANOVA test.

