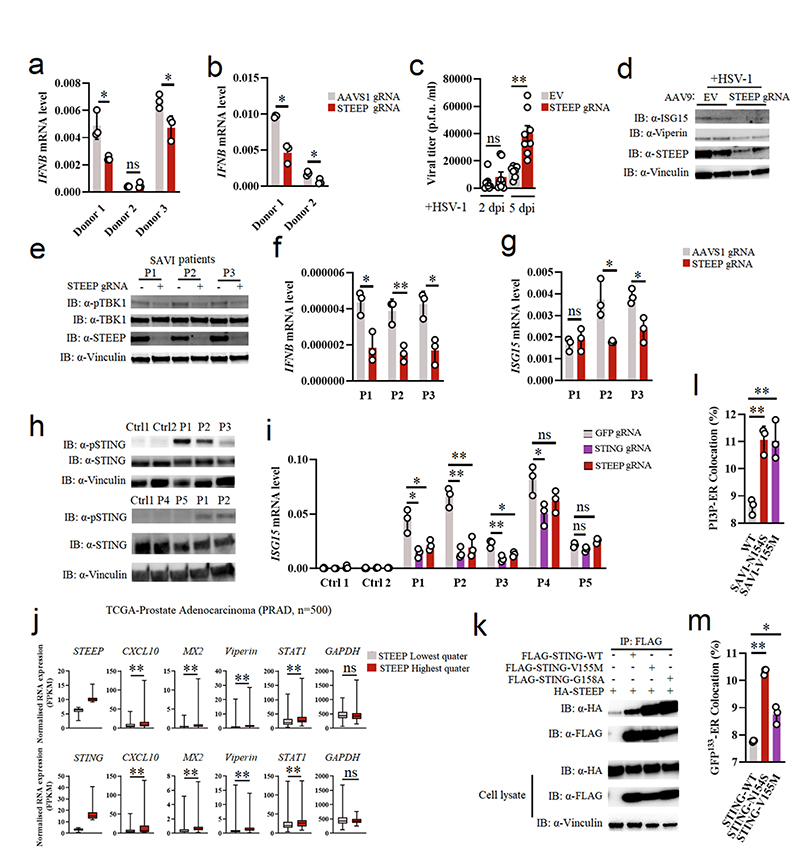
Figure 7. STEEP facilitates STING-dependent antiviral defense and pathological signaling.
(a, b) Primary human fibroblasts and monocyte-derived macrophages treated with Cas9 and gRNAs as indicated were stimulated with vehicle or cGAMP (100 nM, 2h). Total RNA was harvested and IFNB levels measured. (n = 3) (a, *P = 0.049, ns P = 0.59, *P = 0.039, left to right; b, *P = 0.021, *P = 0.014, left to right). (c, d) Brain slices from Cas9+ mice treated with Steep-specific sgRNAs were infected with 5 x 10³ PFU HSV1 (c) Viral load in the culture supernatants were determined by plaque assay. Data represent mean +/- st.dev, from n = 8 mice. Statistical analysis: two-tailed Mann-Whitney test (ns P = 0.33, *P = 0.00016, left to right). (d) Immunoblot analysis of ISGs response by indicative proteins in HSV1-infected WT or STEEP KO mouse brain splice (n = 2 mice). Dpi, days post infection. (e-g) Fibroblasts from SAVI patients were treated with Cas9 and the indicated sgRNAs. Whole-cell lysates and total RNA were isolated, and analyzed by immunoblot or RT-qPCR, respectively. e, data are from 3 SAVI patients, and panels f and g data are shown as means +/- st.dev, for n = 3 independent replicates. (ns P = 0.56, *P < 0.05, **P < 0.01). (h) PBMC lysates from healthy controls and five SLE patients were subjected to immunoblotting with antibodies against pSTING (S366), total STING, Vinculin. Data are from n = 2 unrelated healthy donors (Ctrl1, and 2), and n = 5 unrelated SLE patients. (i) Monocytes from two healthy donors and five IFN-high SLE patients were treated with gRNA/Cas9 complexes targeting STING and STEEP. Total RNA was isolated 48 h later and analyzed for ISG15 mRNA levels (n = 3) (ns P > 0.05, *P < 0.05, **P < 0.01). (j) Box plots of TCGA RNA expression profiles in Prostate adenocarcinoma (PRAD). The highest and lowest 25% of expression of STEEP (upper panels) and STING (lower panels) were analyzed by comparing STEEP/STING-high and STEEP/STING-low groups. Statistical analysis: two-tailed Mann-Whitney test. The upper and lower ends of the boxes represent the upper and lower quartiles, and the horizontal line inside the box is median of the dataset. The bar extending parallel from the boxes is the “whiskers”, indicating upper and lower extreme of the dataset (ns P > 0.01, **P < 0.001). (k) Lysates from HEK-293T cells transfected with the indicated STING expression constructs were immunoprecipitated with anti-Flag, and immunoblotted with antibodies directed against HA and FLAG. (n = 3 biologically independent experiments). (l, m) ImageStream analysis of PI3P-ER (l) and ER-GFP133 colocalization (m). HEK-293T cells were transfected with GFP-FYVE/GFP133 and STING/STING-SAVI mutants for 24 h. Fixed cells were incubated with rabbit anti-calreticulin (n = 3 biologically independent experiments) (l, **P = 0.0017, ** P = 0.0053, left to right; m, **P = 3.20E-06, *P = 0.035, left to right).. Data in panels a, b, f, g and i are shown as means of biological technical triplicates +/- st.dev from one representative experiment. For data from ImageStream analysis (panels l and m), each data point represents the percent of the positive cells from one representative sample and are shown as means +/- st.dev. Statistical analysis of data presented in panels a, b, f, and g was used through two-tailed unpaired t-test with welch’s correction, and in panels i, l, and m was performed using two-tailed Student’s t-test.

