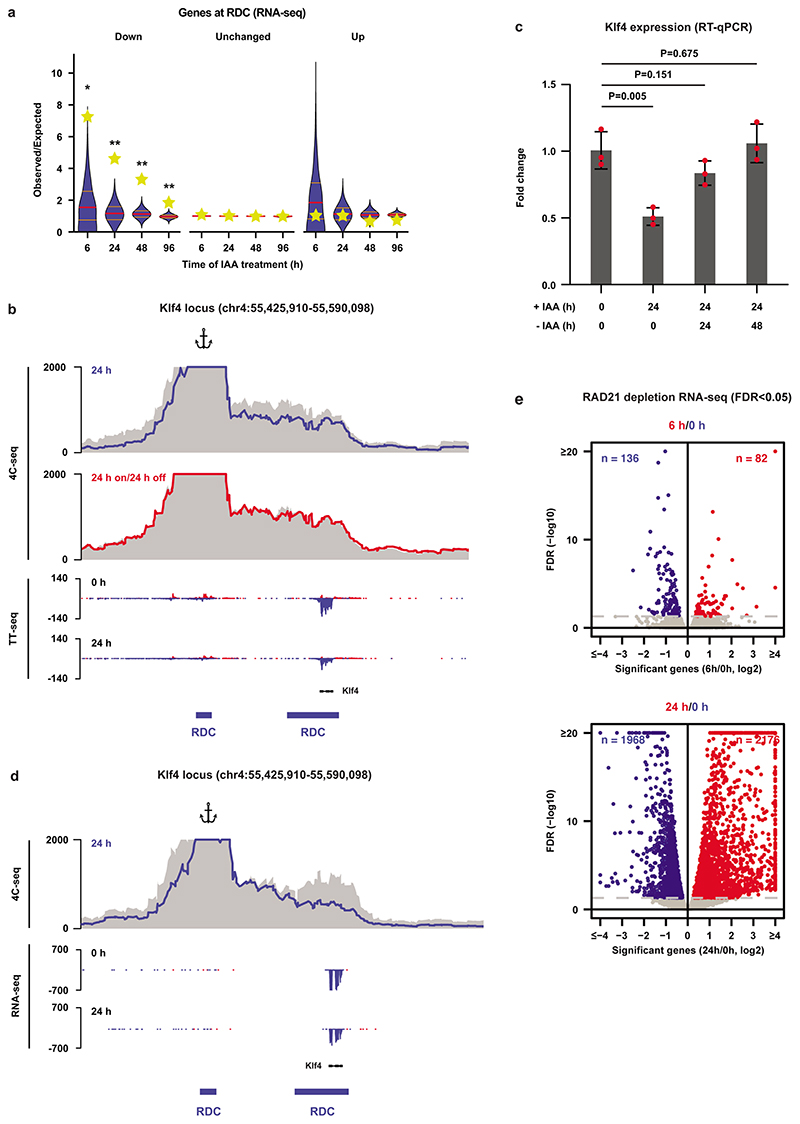
Extended Data Fig. 8. Depletion of WAPL and RAD21 reorganizes the 3D genome and affects gene expression.
a, Effects of WAPL depletion on gene expression similar to Fig. 2d but using RNA-seq. The yellow stars indicate the observed over expected enrichment of the RNA-seq data (n=2 independent experiments), and the violin plots show distribution of enrichment based on 10,000 random circular permutations (red lines: median values, orange lines: interquartile range, *: FDR<0.001, **: FDR<0.0001). b, High-resolution 4C-seq data for the Klf4 locus (viewpoint: Klf4 enhancer, overlapping with the distal RDC of the Klf4 gene). The 4C-seq data is visualized in the same way as Fig. 2e. The bottom two rows show nascent transcription of the Klf4 gene and neighboring region in the untreated (0 h) and treated (24 h) ES cells. c, Expression of the Klf4 gene was quantified by RT-qPCR (n=3 independent experiments) after 24 h of WAPL depletion and 24 h depletion followed by 24/48 h wash-off (two-sided student’s t-test without multiple testing correction, bar height: mean values, error bars: standard deviations, red dots: individual data points). d, High-resolution 4C-seq analysis of the Klf4 locus in the RAD21 depletion experiment (viewpoint: the same as (b)). The 4C-seq data is visualized in the same way as Fig. 2e. The bottom two rows show expression of the Klf4 gene and neighboring region in the untreated (0 h) and treated (24 h) ES cells. e, Global effects of RAD21 depletion on gene expression at early time points (6 and 24 h).

