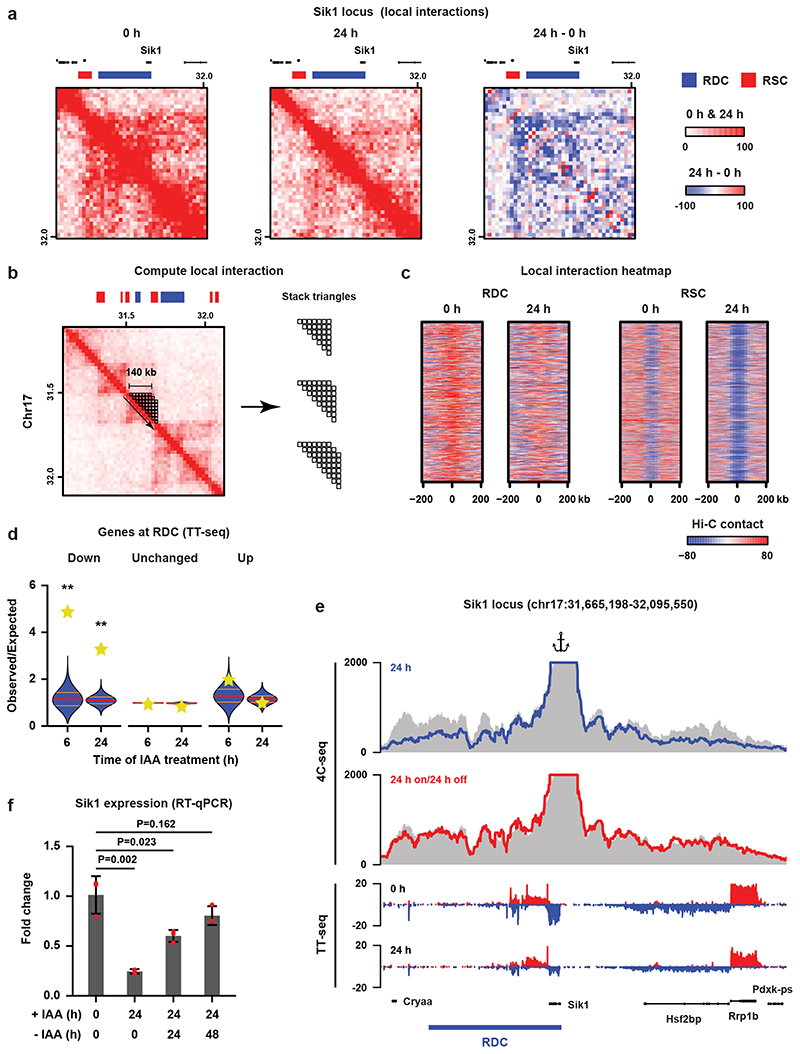
Fig. 2. Cohesin turnover creates regions of increased self-interaction and regulates transcription.
a, Hi-C data and RDC and RSC locations shown for the Sik1 locus. Third panel shows differential Hi-C contacts between untreated and 24 h IAA-treated cells. b, Calculation of the self-interaction (SI) score (see Methods). c, Heatmaps show alignment of the SI scores for RDCs and RSCs. d, For every RDC, the closest gene was identified and we determined whether the fraction of genes that were significantly down- or upregulated or showed no significant change in the TT-seq analysis. The yellow stars indicate the observed over expected enrichment of the TT-seq data (n = 2 independent experiments), and the violin plots show distribution of enrichment based on 10,000 random circular permutations (red lines: median values, orange lines: interquartile range, **: P < 0.0001). e, High-resolution 4C-seq data for the Sik1 locus (viewpoint: the Sik1 promoter). Top two rows show the contact profile at 24 h after WAPL depletion (blue line) and 24 h depletion followed by 24 h wash-off (red line) compared to the untreated cells (grey area).The bottom two rows show nascent transcription of all the genes within the same regions in the untreated (0 h) and treated (24 h) cells. f, Expression of the Sik1 gene was quantified by RT-qPCR (n = 3 independent experiments) after 24 h of WAPL depletion and 24 h depletion followed by 24/48 h wash-off (two-sided Student’s t-test without multiple testing correction, bar height: mean values, error bars: standard deviations, red dots: individual data points).

