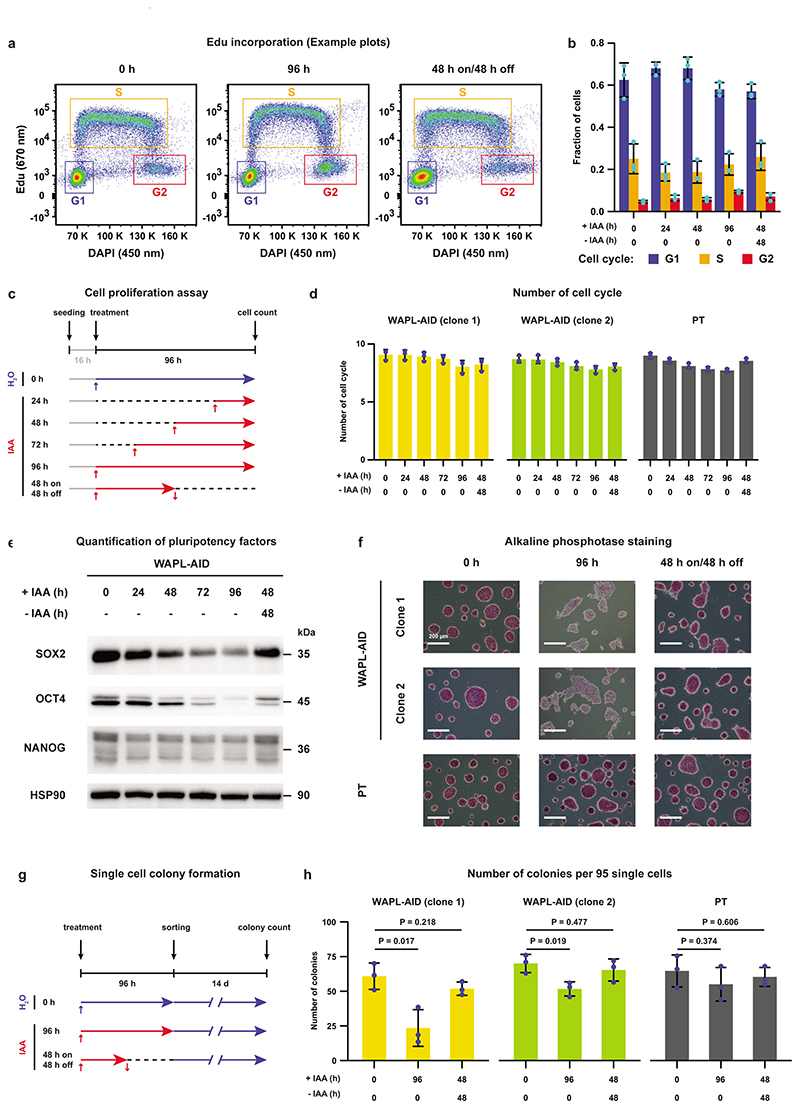
Extended Data Fig. 2. Effects of WAPL depletion on cell cycle and pluripotency of ES cells.
a, FACS plots showing EdU incorporation to measure the cycle phase of individual cells. All single cells are gated, and G1, S and G2 cells are then separated using the blue, orange and red gates, respectively. b, Quantification of cycle phases based on DAPI/EdU FACS analysis for various times after WAPL depletion (n=3 independent experiments). Height of bar indicates mean value. Error bars show standard deviation. Cyan dots show the value of individual measurements. c, An illustration of cell proliferation assay following WAPL depletion. d, Cell cycles measured following WAPL depletion (n=3 independent experiments). Height of bar indicates mean value. Error bars show standard deviation. Blue dots show the value of individual measurements. e, Western blot showing the protein levels of the pluripotency transcription factors SOX2, OCT4 and NANOG (cropped, n=1). f, Alkaline phosphatase (AP) staining is measured as a marker for pluripotency on the untreated (0 h), treated (96 h) and 48 h treatment followed by 48 h wash-off WAPL-AID and parental cell line (representative images from 2 independent clones). g, An illustration of single cell colony formation experiment following WAPL depletion. h, Single cell colony formation measured following WAPL depletion (n=3 independent experiments). Height of bar indicates mean value. Error bars show standard deviation. Blue dots show the value of individual measurements.

