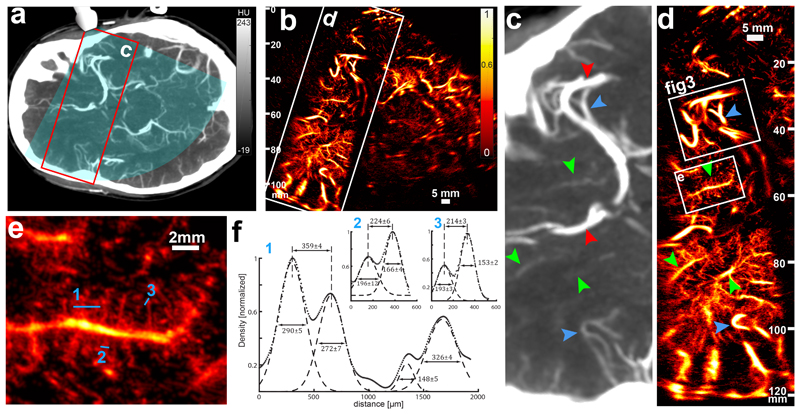
Figure 2. Estimation of the ULM resolution in a standard imaging case.
a. Patient brain axial CT scan section (6mm-thick slab) depicting the ultrasonic field of view (blue overlay) and the ROI in c and d (red rectangle). b. ULM image (2 min 15 s of acquisition) obtained in the same section, with the ROI in c and d. Replicates in 2c-e are only technical. Single micrograph. Scale Bar 5 mm c. The CT scan shows the distal part of the middle cerebral artery (red arrow, top) and a segment of the anterior cerebral artery (red arrow, bottom). Very visible vessels (blue arrowheads) are also depicted as landmarks for visual comparison with ULM image d. Some structures are faintly observable (green arrowheads) d. ULM brain imaging in the same ROI (up to 120 mm depth). Blue and green arrowheads are the same landmarks than in c. Two ROIs (white boxes) are represented for further quantification in e and f and in figure 3. e. ROI (15 × 16 mm) delineating a small penetrating vessel and its radial ramifications. Numbered blue lines are used for cross section profiling in f. f. Cross sections of a wide set of vessels (1) and two pairs of close vessels (2 and 3). Dots represent the image data (see Density and Velocity display in M&M) (arbitrary unit) and dashed lines the Gaussian fit of the vessel cross sections. Inter-peak distance and full width at half maximum are given in μm with 95% confidence intervals.

