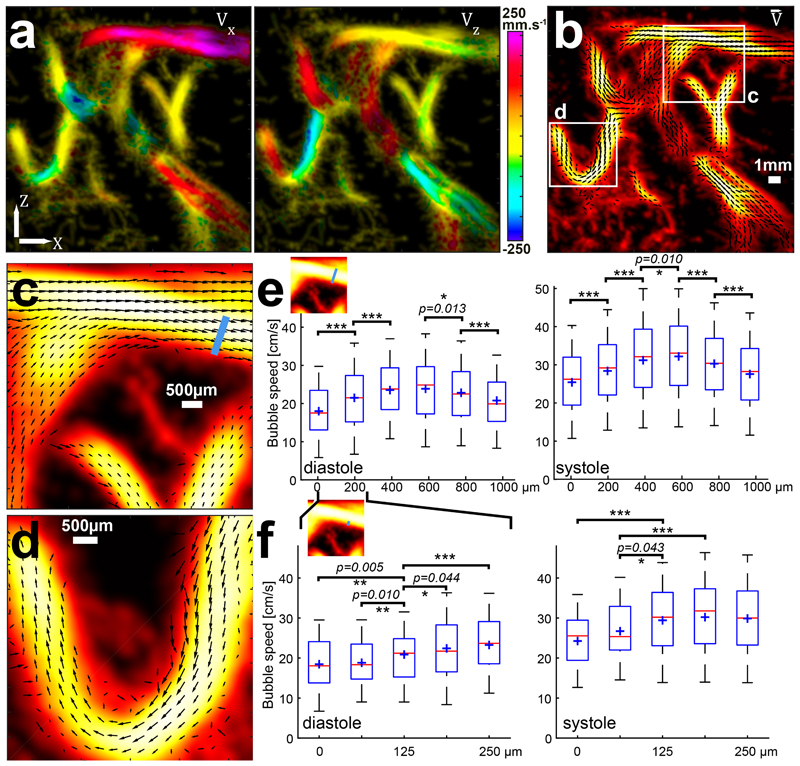
Figure 3. ULM characterizes hemodynamics and discrimates diastolic and systolic flow.
a. X and Z component of the speed vector extracted from the bubble trajectories overlaid on the density map. Single Micrograph. Scale Bar 1mm. b. Combination of these two components enable quantitative representation of the flow vector fields inside those 1 mm wide cerebral vessels. Two ROIs are drawn for further zoom in c and d. c. A 6 × 6 mm ROI of the speed vector representation shows two superimposed vessels (top) (crossing without junction). The two bottom vessels, with lower flow speeds, are joining veins. Black arrows quantify the local flow speed (Arrow direction corresponds to the flow direction and arrow amplitude corresponds to the blood flow amplitude) d. A 5 × 5 mm ROI showing a sharp turn in an artery. The velocity profile across the vessel is very asymmetric due to the tortuosity of the vessel. e. Quantitative assessment of the velocity profile across the whole 1 mm section of the artery of c. (blue line in the thumbnail). Bubble velocities are gathered in 188 μm wide bins (λ/4≡ diffraction-limited lateral resolution/8 at this depth); red central line indicates the median; boxes, 25th and 75th percentile; whiskers are ± 1.26 σ corresponding to 80% coverage in the Gaussian hypothesis (blue cross represents mean value). Significant differences in the mean value have been tested with p < 0.05 (*), p < 0.01 (**) and p < 0.001 (***), Analysis of variance (ANOVA) with post hoc t-test with Bonferroni correction. This quantitative velocity assessment has been done during diastole (left panel) and systole (right panel), showing largely increased bubble speeds during systole. Mean and variance (in mm/s) and samples number (bubble positions) corresponding from left to right bins (188 μm): 180+/− 78 (N=714); 215+/− 86 (N=2162); 235+/− 83 (N=2593); 239+/− 90 (N=2081); 228+/− 83 (N=1194); 208+/− 79 (N=670) during diastole (p-values are 1.1.10−19, 7.0.10−15, 0.013 and 1.3.10−5). and 254+/− 95 (N=579); 284+/− 103 (N=1575); 312+/− 106 (N= 2619); 322+/− 100 (N=2410); 303+/− 92 (N=1206); 276+/−99 (N=547) during systole (p-values are 6,6.10−8, 2,3.10−16, 0.010, 3,7.10−6 and 5,7.10−6). f. The same quantitative assessment, on the extreme border of the vessel, on a 250 μm wide cross section (see thumbnail). Bins are now 62.5 μm wide (λ/12≡ diffraction-limited lateral resolution/24 at this depth) and still show significant speed differences where the speed changes are the sharpest. Mean, variance and samples number (bubble positions) correspond from left to right bins with 65 μm: 185+/− 70 (N=213); 188+/− 71 (N=301); 209+/− 76 (N=401); 225+/− 88 (N=510); 233+/− 87 (N=525) during diastole (displayed p-values are 1-3 5.10−3, 2-3 0.010, 3-4 0.044, 3-5 9,5.10−5) and 243+/−90 (N=173); 267+/− 88 (N=206); 294+/− 95 (N=230); 302+/− 102 (N=364); 299+/− 101 (N=528) during systole (displayed p-values are (1-3) 2.1.10−6, (2-3) 0.04, (2-4) 5.10−4, (2-5) 0.01).

