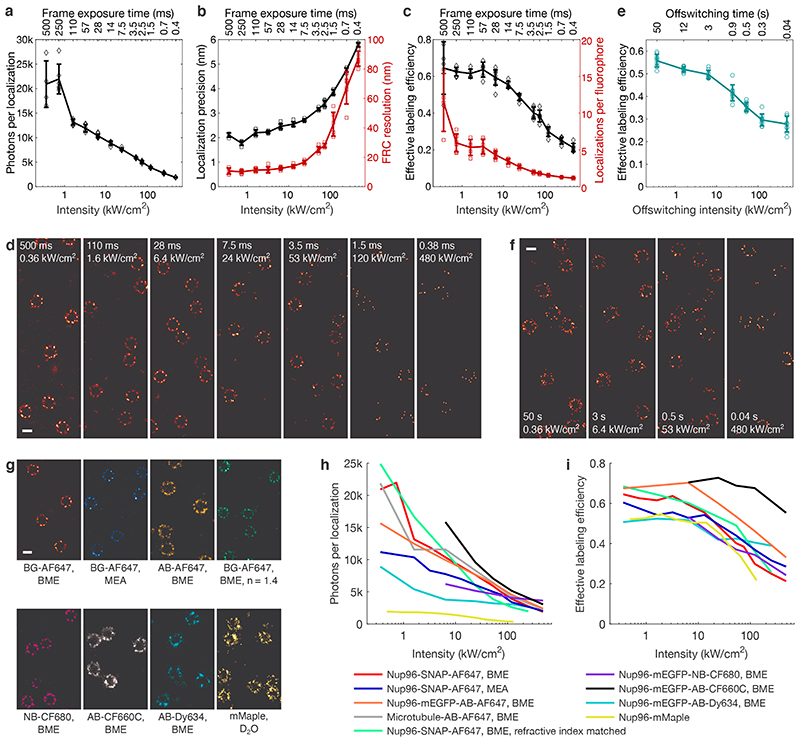
Figure 1. Effect of laser intensity and imaging speed on image quality.
a, Mean number of photons per localization, b, median localization precision and Fourier Ring Correlation (FRC) resolution, and c, effective labeling efficiency and mean number of localizations per fluorophore for AF647 in BME-based buffer as a function of the excitation intensity and single frame exposure time. d, SMLM images of Nup96-SNAP-AF647 corresponding to data shown in a - c. e, Effective labeling efficiency as a function of different off-switching intensities, recorded at identical imaging intensities of 61 kW/cm2. f, SMLM images of Nup96-SNAP-AF647 corresponding to data shown in e. g, SMLM images of Nup96 using different buffers or labeling approaches recorded at 6.4 kW/cm2 (organic dyes) or 1.9 kW/cm2 (mMaple). h, Mean number of photons per localization, and i, effective labeling efficiency as a function of excitation intensity for different buffers or labeling approaches. All data taken on U2OS cells. Error bars indicate mean ± standard deviation. See Supplementary Table 1 for sample size and replicates. See Supplementary Figures 2-10 for detailed data of individual conditions. Scale bars 100 nm.

