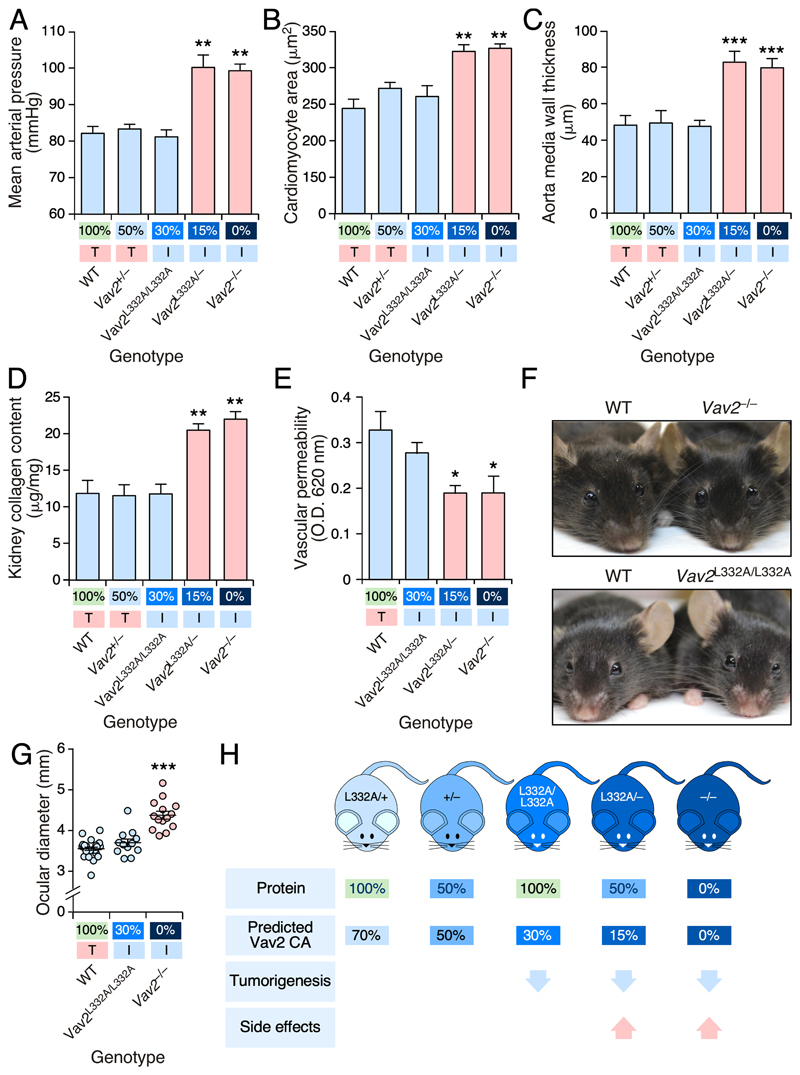
Figure 4. The level of Vav2 catalytic activity inhibition determines the generation of negative side effects in mice.
(A-D) Mean arterial pressure (A), cardiomyocyte area (B), aorta media wall thickness (C) and kidney collagen content (D) present in mice of the indicated genotypes (A-D, bottom). Normal and pathophysiological values are shown using blue and red bars, respectively. The amount of predicted in vivo Vav2 exchange activity for each genotype is shown at the bottom (the same representation was used in the panels E and G below). In addition, we indicate whether these animals develop normal (T, shaded in red) or impaired (I, shaded in green) skin tumorigenesis according to the results found in Figure 3. **, P < 0.01; ***, P < 0.001 (Student’s t-test, n = 6 per genotype).
(E) Vascular permeability exhibited by mice of the indicated genotypes. Color code of bars and information included in X axis is as in panel A. O.D., optical density. *, P < 0.05 relative to value found in WT mice (Student’s t-test, n = 6 per genotype).
(F and G) Representative example (F) and quantitation (G) of the ocular diameters of mice of the indicated genotypes. ***, P < 0.001 (Student’s t-test, n = 28, 12, and 14 in the case of WT, Vav2 L332A/L332A, and Vav2 –/– mice, respectively).
(H) Summary of the results obtained in this work.
In A-E and G, data represent the mean ± SEM.

