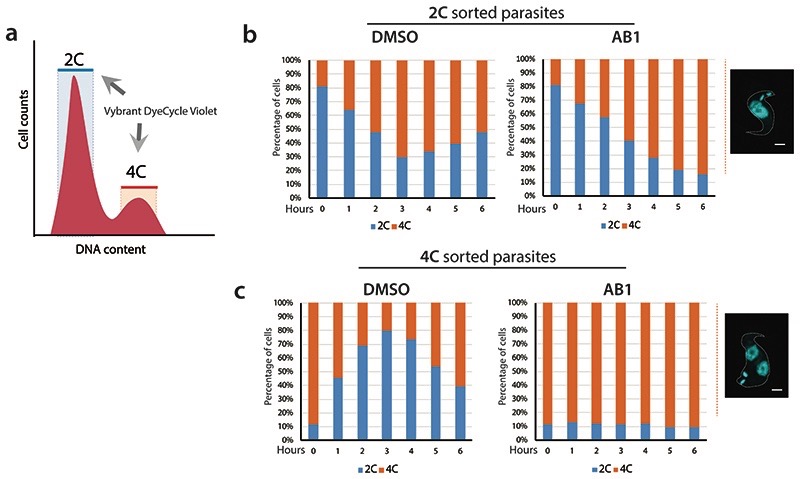
Extended Data Fig. 8. Cell cycle analysis of synchronized T. brucei after treatment with AB1.
(a) Diagram of 2C (blue) and 4C (orange) cell cycle synchronised bloodstream form T. brucei using Vybrant DyeCycle Violet-based cell sorting. The selected area shows those cells that were gated for sorting.
(b - c) After release, 2C and 4C synchronised parasites were treated or not with 5x EC50 AB1. Then, cell samples were collected every hour for DNA flow cytometry analysis of 2C (in blue) and 4C (orange) populations, up to 6 hours. A representative micrograph after 6 hours of treatment is also provided in each condition. Scale bar, 2μm. The data are representative of two biological experiments.

