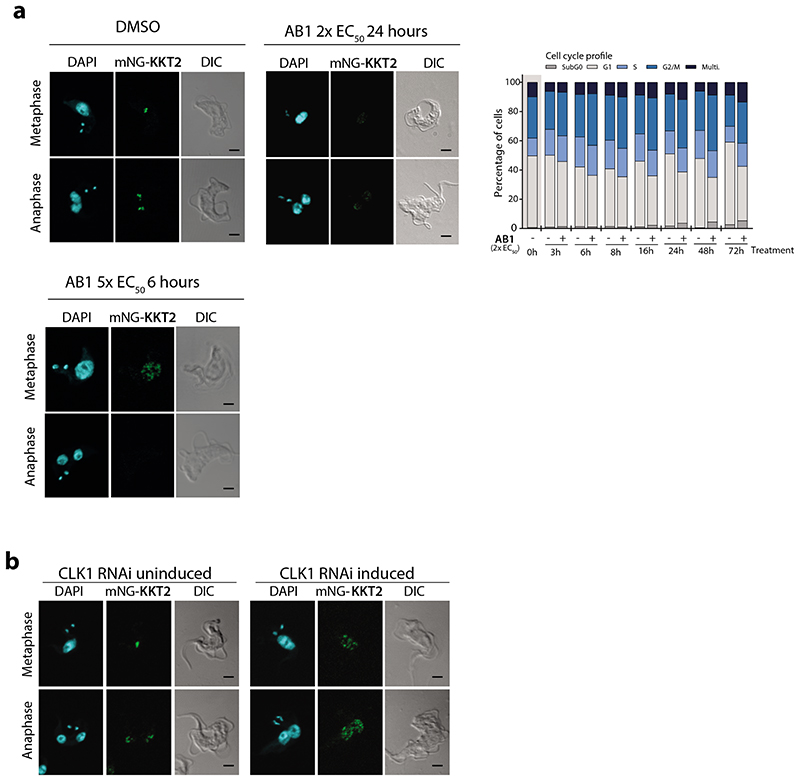
Fig. 5. CLK1 inhibition impairs inner kinetochore dynamics.
(a) Localization of kinetochore protein KKT2 after CLK1 inhibition by AB1. Parasites were incubated or not for 24 h with 2x EC50 (upper panel) or 6 h with 5 x EC50 AB1 (lower panel). Representative fluorescence micrographs, showing bloodstream form parasites endogenously expressing N-terminal mNeonGreen (mNG) tagged KKT2. Cells in metaphase and anaphase are shown. Cells were counterstained with DAPI to visualize DNA (cyan). The right panel shows the Nomarsky (DIC) corresponding images. Scale bar, 2μm. Upper right panel shows cell cycle progression after treatment with 2x EC50 AB1 for 72 h. Data are representative from one of three independent biological replicates with similar results.
(b) Localization of KKT2 after CLK1 depletion by RNAi. Representative fluorescence micrographs, showing 24 h induction of CLK1 RNAi in bloodstream form parasites endogenously expressing N-terminal mNeonGreen (mNG) labelled KKT2, compared with not induced control cells in metaphase and anaphase are shown. Cells were counterstained with DAPI to visualize DNA (cyan). The right panel shows the Nomarsky (DIC) corresponding images. Scale bar, 2μm. Data are representative from one of three independent biological replicates with similar results.

