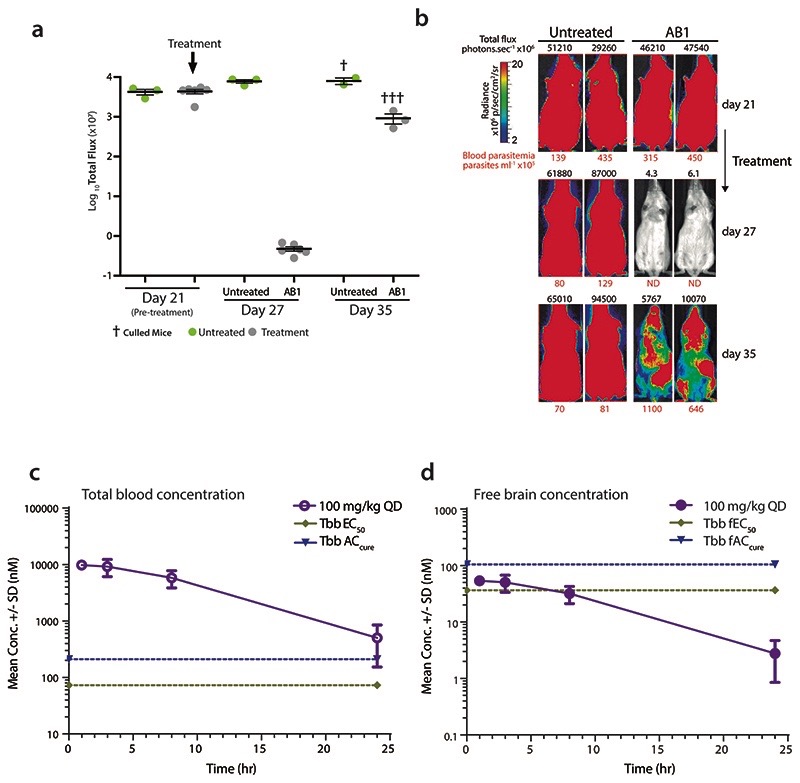
Extended Data Fig. 2. AB1 reduces parasitaemia in a GVR35 strain CNS mouse model of human African trypanosomiasis and pharmacokinetics of AB1.
(a) Whole body in vivo imaging of bioluminescent T. brucei before and after AB1 treatment; T. b. brucei (GVR35-VSL2) –infected mice (Day 21) were orally treated with 50 mg kg-1 AB1 once-daily for 7 days (n=6 mice, grey) or left untreated (n=3 mice, green); Data represent the mean ± standard deviation of each mice group, and symbols show whole body bioluminescence values for individual mice; mice were euthanized between days 27 and 35.
(b) Bioluminescence images of mice showing ventral views of two representative mice from the untreated and AB1-treated groups over the full course of infection. The colour scale indicates bioluminescent radiance in photons/sec/cm2/sr. ND, not detected. Blood parasitemia (in parasites mL-1, red font below image) and whole mouse total flux (in photons per second, black font above image) values of each animal are shown. The same two representative mice are shown for all time points.
(c) Total blood concentration of AB1 in mice at various time points after last dose from the T. b. brucei GVR35 strain CNS mouse model of HAT. At each time point, 3 mice were bled to collect samples, each point represents mean ± standard deviation.
(d) Free brain concentrations of AB1 compound in mice calculated by taking into consideration the brain to plasma ratio (0.5), mice plasma protein binding (94%) and rat brain tissue binding (>99%). Each point represents free brain concentrations for n=3 mice and mean ± standard deviation is shown. Note the AB1 concentrations were below T. b. brucei EC50 and ACcure.

