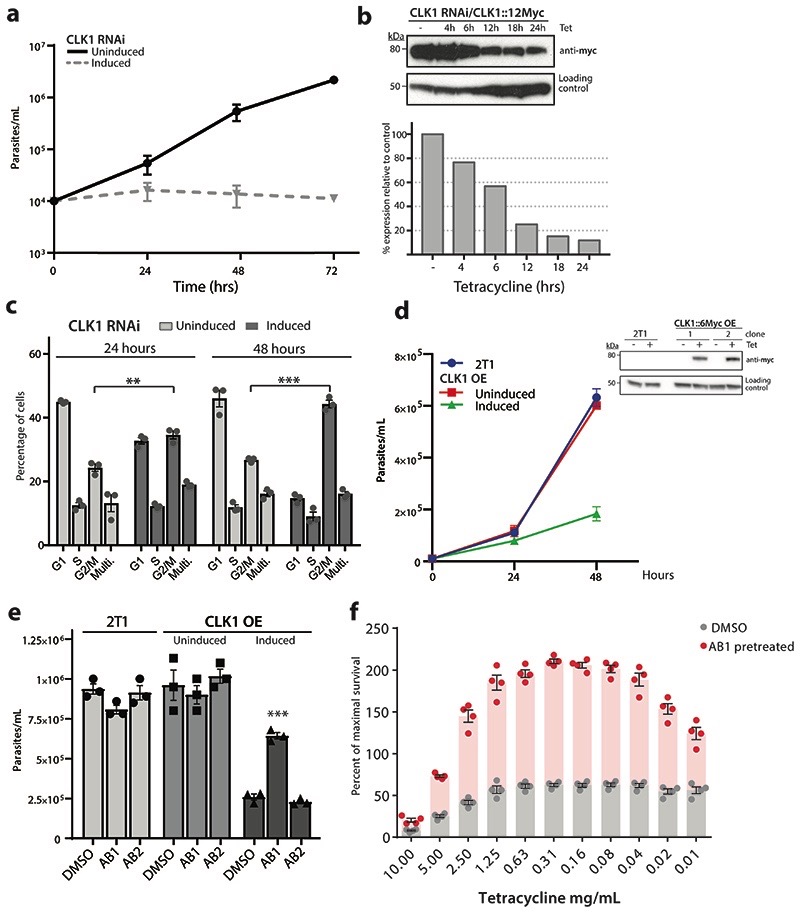
Extended Data Fig. 3. CLK1 target validation and CLK1 over- expression toxicity blockage by AB1.
(a) CLK1 depletion halts cell proliferation. Growth curves of CLK1-depleted bloodstream trypanosomes after RNAi induction with tetracycline (dashed line) is compared with uninduced (solid line) as control. Data represent the mean of two biological replicates.
(b) Efficiency of CLK1 RNAi. Upper panel: Endogenous CLK1::12-myc (predicted MW 70.5 kDa) was detected with anti-myc antibody at different points after RNAi induction. EF-1 alpha protein expression was used as the loading control. Lower panel: Mean intensity of the bands were determined from the Western blot in the upper panel. Density signal of CLK1::12-myc was normalised to EF1α for each time point and the uninduced control and relative expression of CLK1::12-myc to uninduced control is shown. Data are representative from one of two independent biological replicates with similar results.
(c) Depletion of CLK1 induces a G2/M cell cycle arrest. Flow cytometry analysis of DNA content in CLK1-depleted cells (dark grey) and in the uninduced control (light grey) 4 and 48 h after RNAi induction with 1μg mL-1 tetracycline. Mean ± SEM (n=3); P values were calculated using a Two-tailed Student’s t-tests comparing G2/M percentage with uninduced control where ** p =2.7 x10⁻³ (24 h), *** p =1.6 x10⁻⁴ (48 h).
(d) CLK1 overexpression impairs parasite growth. Top: 48 h growth curve of induced TbCLK1 over- expression (OE) compared with uninduced cell line and parental T. b. brucei 2T1 wild-type parasites. Data represent the mean ± standard deviation of three biological replicates where P- values were calculated using a Two-tailed Student’s t-test; *** p= 5.9 x 10⁻⁵. Bottom: CLK1-6-myc overexpression of two clones was assessed by western blot, using an anti-myc antibody. EF-1 alpha protein expression was used as the loading control.
(e) Incubation with AB1 impairs toxicity of CLK1 overexpression. Parental 2T1 and CLK1 over- expression (OE) cell lines were pre-incubated or not 18 h with 60 nM of AB1 and AB2 and then incubated with tetracycline during 48 h. Bars show the mean ± SEM (n = 3 biological replicates), and symbols represent the individual parasite counts. *** p = 1.6 x10⁻⁴ compared to induced CLK1 OE preincubated with DMSO.
(f) CLK1 target validation using non-toxic concentrations of AB1. 24 h pre-treatment with AB1 non-toxic concentrations (60 nM) reduced the loss of fitness caused by CLK1 overexpression induced by tetracycline. Bars represent the mean ± SEM (n = 4 biological replicates) of the percentage of maximal survival in each condition, and symbols represent the individual replicates. p < 0.001 compared to DMSO control for all the points.

