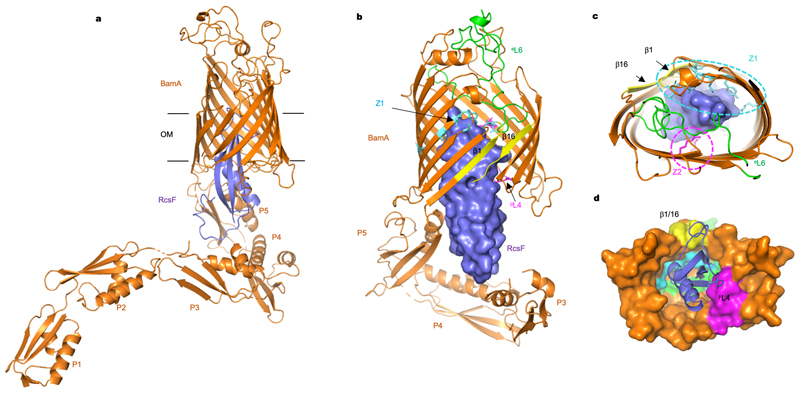
Figure 2. Structure of the BamA-RcsF complex.
(a) Ribbon diagram of the BamA-RcsF complex in side view. BamA, gold; RcsF, blue. (b, c) Front (b) and extracellular (c) views of BamA-RcsF, with RcsF shown as a solvent-accessible surface. POTRA domains 1 and 2 have been omitted for clarity. BamA eL6, green; pL4, magenta. Putative RcsF-interacting residues in contact zones Z1 and Z2 of the BamA β-barrel are colored cyan and magenta, respectively, and shown as sticks. Strands β1 and β16, which form the proposed “lateral gate” of the BamA β-barrel1, are yellow. (d) Periplasmic view of the BamA-RcsF complex, with the BamA β-barrel shown as a solvent-accessible surface and RcsF as a ribbon. Colors are as in panels b and c. POTRA domains were omitted for clarity.

