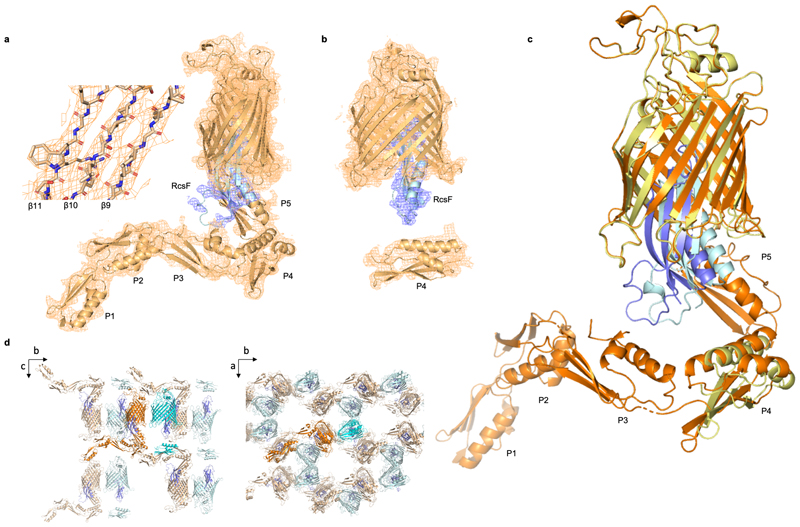
Extended Data Fig. 2. Crystal structure of the BamA-RcsF complex.
(a, b) Final 2Fo-Fc electron map of the BamA-RcsF complex, shown with a map contour level of 0.08 e-/Å3 (root mean square deviation 1.02 Å). The asymmetric unit of the crystals holds two BamA-RcsF copies, one revealing interpretable electron density for the full BamA sequence (a), and a second revealing unambiguous density for POTRA domain 4 only (b). In the second copy (b), the electron density corresponding to POTRA domains 1, 2, 3, and 5 is too weak to allow unambiguous rigid body placement of the domains. All descriptions and images in the main text are based on the first copy (a). (c) Overlay of two BamA-RcsF complexes in the asymmetric unit. The first complex depicts BamA in gold and RcsF in blue, while these molecules are yellow and light blue, respectively, in the second complex. In both copies, RcsF makes an average displacement of 4 Å relative to the BamA β-barrel. (d) Crystal packing of the BamA-RcsF complex viewed along the a- (left) and c-axis (right). For the first copy of the BamA-RcsF complex in the asymmetric unit (orange-slate) the conformation of the POTRA domains is stabilized by the packing along the b-axis, whilst for the second copy (cyan-slate) only POTRA domain 4 is involved in crystal contacts. In the latter, POTRA 5, 3, 2 and 1 are not in contact with neighboring molecules and show weak electron density only due to the lack of conformational stabilization.

