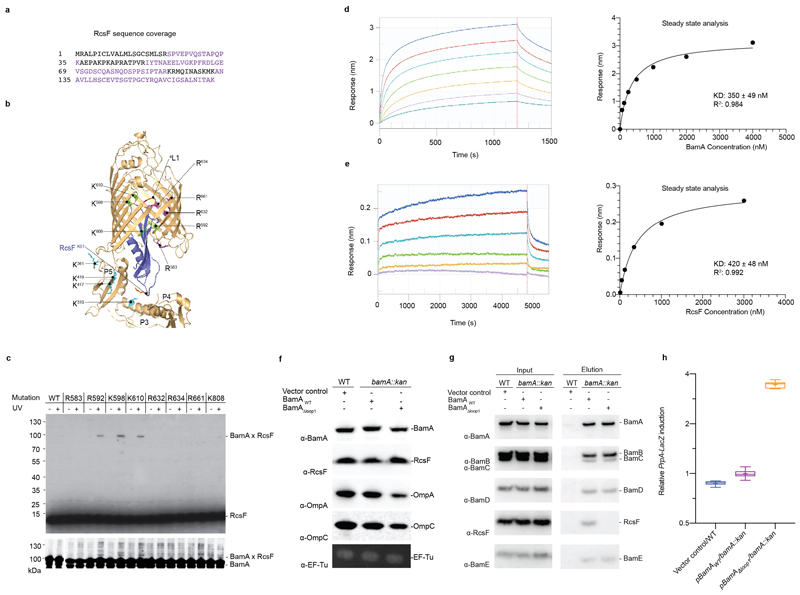
Extended Data Fig. 4. Validation of the BamA-RcsF structure.
(a) RcsF aminoacid sequence. The sequence coverage of the XL-MS experiment was about 60% as highlighted in violet (b) Ribbon diagram of the BamA-RcsF structure. Highlighted residues show sites mutated to amber for incorporation of the photoreactive lysine analog DiZPK. Sites that crosslink to RcsF are green, sites that show no crosslinking are magenta. Mutation of extracellular loop 1 (eL1; red) leads to loss of RcsF binding (see panel g). BamA sidechains found to crosslink with RcsF by means of the homobifunctional amine-reactive crosslinker disuccinimidyl dibutyric urea (DSBU) are shown as sticks and colored cyan. Residue K61 from RcsF, which was found to crosslink to BamA using DSBU, is shown as a stick and colored orange. The other two RcsF residues (K42 and K134) that could be crosslinked to BamA are not visible in this structural model. (c) In vivo photocrosslinking experiment in which cells expressing the BamA mutants containing DiZPK at the indicated positions were treated (+) or not (-) with ultraviolet light. Proteins samples were analyzed via SDS-PAGE and immunoblotted with anti-RcsF or anti-BamA antibodies, showing that the photo-crosslinked complexes contain BamA and RcsF. WT, wild type. (d,e) Sensorgrams from biolayer interferometry (left) and corresponding equilibrium binding plots (right) of immobilized RcsF titrated with BamA (d) or immobilized BamA titrated with RcsF (e), n=1 biologically independent experiment. (f) The levels of major OMPs are slightly decreased in cells expressing BamAΔloop1. WT cells harboring the empty plasmid (pAM238) were used as control and EF-Tu expression levels were analyzed as loading control. n= 3 biologically independent experiments. (g) Deletion of loop 1 in BamA prevents RcsF from being pulled down with BamA. WT cells harboring the empty plasmid (pAM238) were used as control. n= 3 biologically independent experiments. (h) Overexpression of pBamAΔLoop1 in a bamA deletion strain activates the Rcs system compared to WT. A chromosomal rprA::lacZ fusion was used to monitor Rcs activity, and specific β-galactosidase activity was measured from cells at mid-log phase (OD600=0.5). Boxplot with whiskers from minimum to maximum. All values were normalized to the average activity obtained for WT cells harbouring the empty plasmid (pET3a) obtained from N=8 biologically independent experiments. Mean is showed as +. WT, wild-type; Kan, kanamycin.

