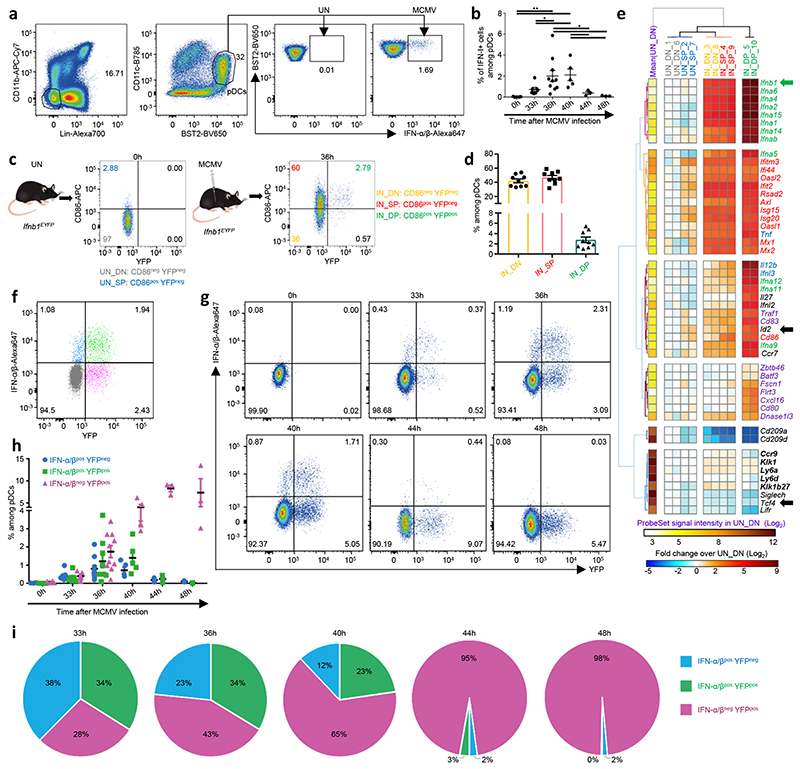
Fig. 1. Bulk transcriptional profiling suggests the induction of distinct pDC activation states in vivo during MCMV infection.
a, pDC gating strategy within live single-cells. b, Percentages of IFN-I+ cells within pDCs at indicated time points afterMCMV infection. *p<0.05, **p<0.01 (One-way ANOVA). c, YFP and CD86 co-expression in pDCs isolated from uninfected (UN) or 36h MCMV-infected (IN) Ifnb1EYFP mice. d, Percentages of subpopulations within splenic pDCs of 36h MCMV-infected Ifnb1EYFP mice. The data are shown for n=9 individual mice pooled from 3 independent experiments. e, Heatmap showing mRNA expression levels of selected genes (rows) across pDC subpopulations (columns), with hierarchical clustering using City block distance for cells and Euclidian distance for genes. f, Co-expression of IFN-α/β and YFP in pDCs isolated from one representative 36h MCMV-infected Ifnb1Eyfp mouse. g, Co-expression of IFN-α/β and YFP in pDCs isolated from Ifnb1Eyfp mice, at 0h (UN), 33h, 36h, 40h, 44h and 48h after MCMV infection. For each time point, one representative mouse is shown. h, Proportions of IFN-α/β+YFP–, IFN-α/β+YFP+ and IFN-α/β–YFP+ cells amongst pDCs, at indicated time points. i, Pie charts recapitulating the mean proportions of cells expressing IFN-I and/or YFP (see color key) amongst pDC positive for either molecule at different time points during the course of MCMV infection in Ifnb1Eyfp mice. For panels b, d and h, data are presented as mean±s.e.m, and for panel i as mean percentage. Panels b and f-i show data from individual mice, with n=5 at 0h, 7 at 33h, 10 at 36h, 5 at 40h, and 3 at 44h and 48h, pooled from 2 (resp. 3) independent experiments for 33h and 40h (resp. 0h and 36h). One experiment was performed for 44h and 48h.

