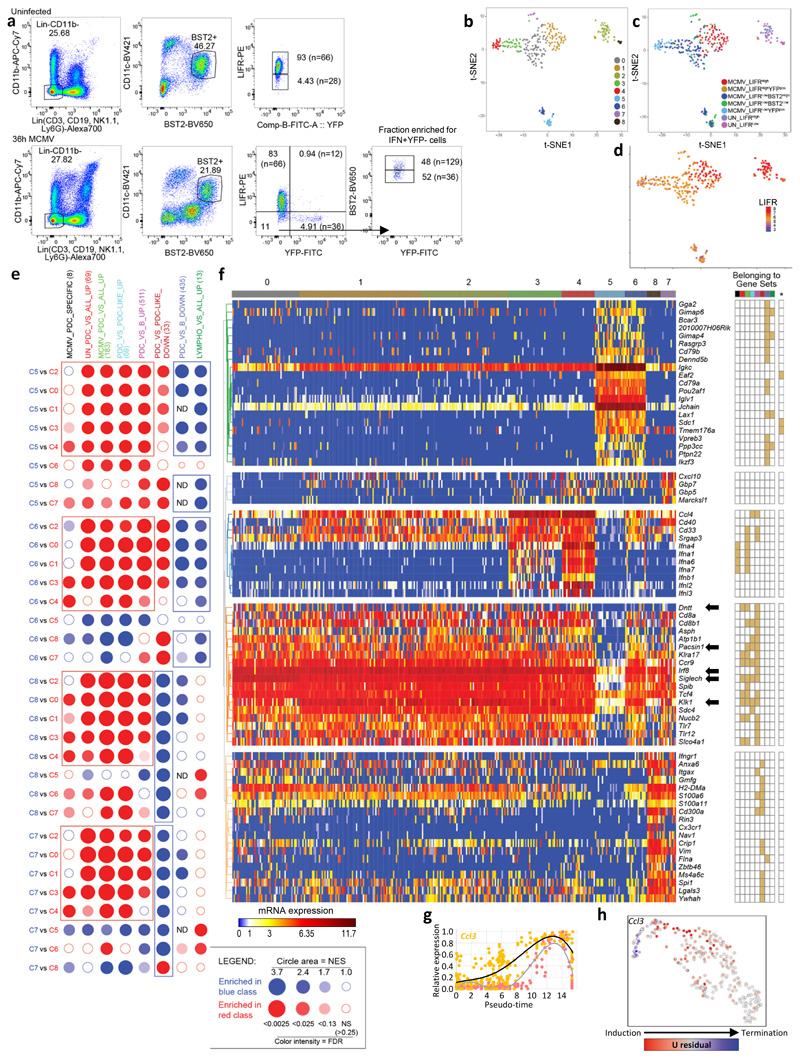
Extended Data Fig. 2. Design and quality control of the SS2 dataset#2.
a, Flow cytometry gating and overall strategy for index sorting of pDCs from one uninfected (UN, top panel) and one 36h MCMV-infected (bottom panel) Ifnb1Eyfp mice, using LIFR and BST2 expression levels to enrich IFN-I− Eyfp + pDCs, for scRNAseq. Numbers in parentheses indicate the total number of cells sorted in each gate. b, t-SNE and cell clustering analysis for the 323 cells that passed quality controls. c, Sorting phenotype projection on the t-SNE space. d, LIFR expression projection on the t-SNE space. Data are expressed as inverse hyperbolic arcsine (asinh) of fluorescence intensity. e, BubbleMap illustrating GSEA results for 8 selected gene sets (columns) in pairwise comparisons between the cell clusters (rows) identified in (b). ND, not determined. f, Heatmap (left) showing mRNA expression levels of representative genes (rows) across the cell clusters (columns) identified in (b). Most of the genes shown were selected due to their contribution to the GSEA results from (e), as informed by the grid on the right of the heatmap where filled cells mean belonging of the gene (row) to a gene set (column). The gene set order and color code on the top of the grid is the same as in panel e. The far right column of the grid (*) corresponds to genes selectively expressed to high levels in plasmocytes. g, Normalized expression of Ccl3 vs the IFN-I meta-gene along pseudo-time. h, Projection on the UMAP space of the predicted induction (red) vs termination (blue) of Ccl3 transcription.

