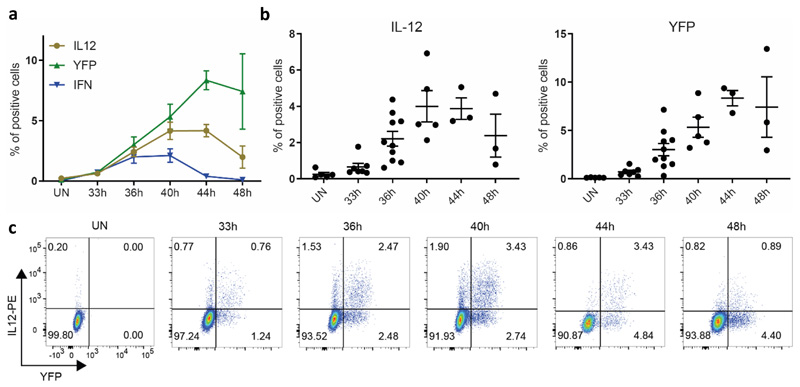
Extended Data Fig. 3. Kinetics of IL-12 production by pDCs during MCMV infection.
a, Frequency (mean ± s.e.m.) of YFP+, IFN+ and IL-12+ pDCs isolated from Ifnb1Eyfp mice at indicated time points after MCMV infection. b, Data from individual animals for the frequencies of IL-12+ and YFP+ cells in pDCs isolated from Ifnb1Eyfp mice at indicated time points, with overlay of mean ± s.e.m. c, Flow cytometry dot plots showing IL-12 vs YFP expression in pDCs isolated from one representative Ifnb1Eyfp mouse for each time point. The data from all panels were analyzed from the same experiments, with 5 mice at 0h, 7 at 33h, 10 at 36h, 5 at 40h, 3 at 44h and 3 at 48h, from one experiment for 44h and 48h, or pooled from 2 (resp. 3) independent experiments for 33h and 44h (resp. 36h).

