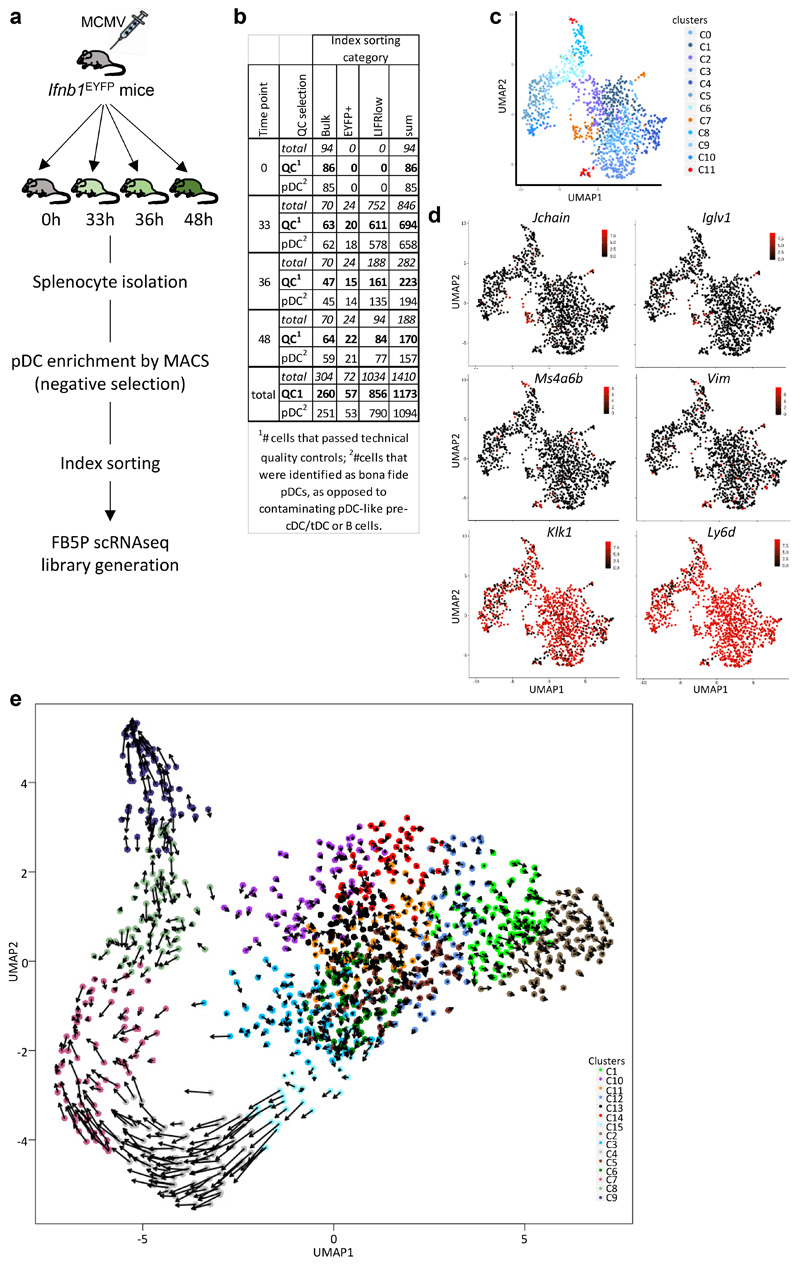
Extended Data Fig. 5. Design, quality controls and RNA velocity analysis of the FB5P kinetics dataset.
a, Experimental design. For each time point, splenocytes were isolated from one Ifnb1 Eyfp mouse, depleted of Lin+ cells by magnetic sorting and used for index sorting of pDCs using three sorting gates: i) total (bulk) pDCs, ii) LIFRlo pDCs irrespective of their YFP expression, and iii) YFP+ pDCs. FB5P-seq scRNAseq libraries were then prepared. b, Table indicating the total numbers of cells sorted for each time point and sorting gate, the numbers of cells that passed quality control upon data analysis, and the number of bona fide pDC ultimately kept after identification and removal of contaminating cell types. c,d, Identification and removal of contaminating B and pDC-like cells. c, UMAP and clustering analysis. The analysis of the genes differentially expressed across clusters combined with their mining for expression across immune cell types by using the MyGeneSet tool of Immgen enabled identification of contaminating B cells (cluster 7, highlighted in orange). A GSEA analysis performed by using BubbleGUM (not shown) enabled identification of contaminating pDC-like cells (cluster 11, highlighted in red). d, Projection on the UMAP space of the expression of two B cell-specific genes, Jchain and Iglv1, two pDC-like cell-specific genes, Ms4a6b and Vim, and 2 genes selectively expressed at high levels in pDCs, Klk1 and Ly6d. e, Projections of the velocity vector of each pDC in the UMAP space obtained after contaminant removal.

