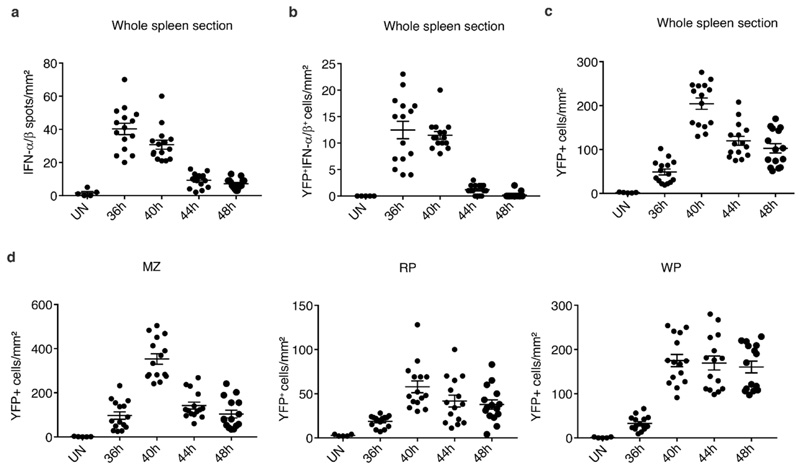
Extended Data Fig. 7. Micro-anatomical locations of splenic YFP+ cells during MCMV infection of Ifnb1Eyfp mice.
(a, b, c) Number of IFN-α/β spots per mm2 (a), of YFP+IFN-α/β+ cells/mm2 (b), and of YFP+ cells per mm2 (c), in whole spleen sections from Ifnb1Eyfp mice at indicated time points after MCMV infection. (d) Number of YFP+ cells per mm2 residing in the different spleen zones. MZ, marginal zone; RP, red pulp; WP, white pulp. Fifteen individual data points are shown on each graph for each time point, corresponding to quantitation of 5 different whole spleen sections per mouse, from 3 different mice, with overlay of mean±s.e.m.

