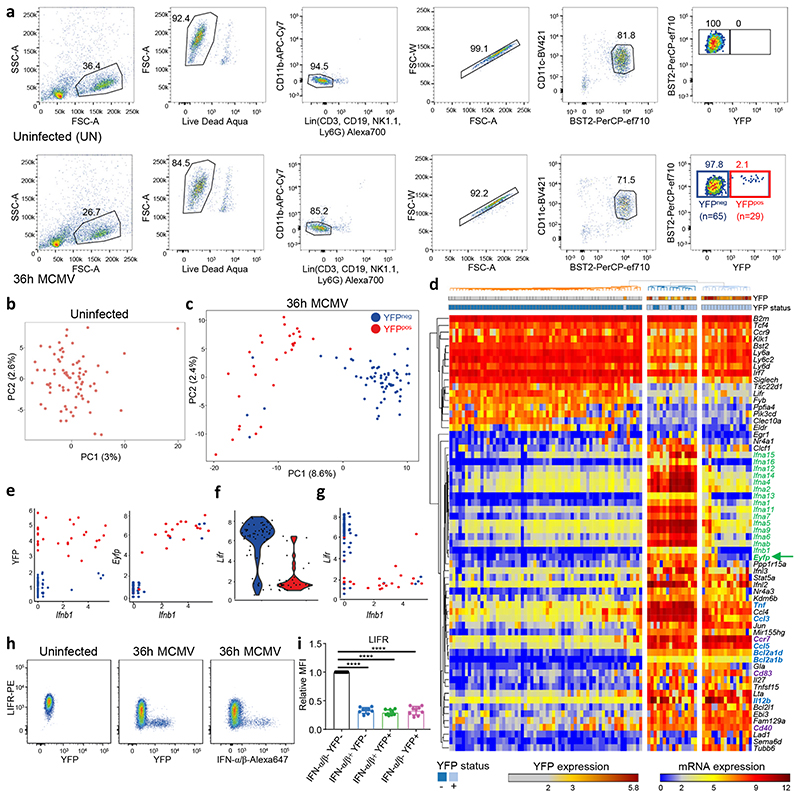
Fig. 2. scRNAseq analysis of pDCs from 36h MCMV-infected mice confirms their heterogeneity and pinpoints to LIFR downregulation as a selective marker of IFN-I-producing pDCs.
a, Flow cytometry gating strategy for index sorting of pDC from one uninfected mouse (top) and from one 36h MCMV-infected mouse (bottom). Numbers in parentheses correspond to the number of cells sorted for each population. b-c, Principal component analysis (PCA) on 1,016 highly variable genes of single pDCs isolated from uninfected, b, or from one MCMV-infected mice (SS2 dataset#1), c, encompassing 29 YFP+ cells (red) and 65 YFP– cells (blue). d, Heatmap showing mRNA expression of selected genes, and YFP protein fluorescence intensity obtained from index sorting data, with hierarchical clustering using one minus Pearson correlation as distance metric for both cells and genes. e, Scatter plots showing Ifnb1 expression vs YFP protein fluorescence intensity (left), or Ifnb1 vs Eyfp mRNA expression (right). f, Violin plot showing Lifr expression in YFP– vs YFP+ pDCs. g, Scatter plot showing Ifnb1 vs Lifr mRNA expression. h, Flow cytometry analysis showing the downregulation of LIFR protein expression on IFN-α/β+ (middle) or YFP+ (right) pDC isolated from 36h MCMV-infected Ifnb1EYFP mice, as compared to pDC isolated from uninfected animals (left). The dot plots shown are from one mouse representative of 10 animals. i, Relative median fluorescence intensity (MFI) of LIFR on IFN-α/β–YFP– (black), IFN-α/β+YFP– (blue), IFN-α/β+YFP+ (green) and IFN-α/β–YFP+ (pink) populations. The data are shown for n=10 individual animals pooled from 2 independent experiments, with overlay of mean±s.e.m. values. ****p<0.0001 (One-way ANOVA with Tukey’s post hoc test).

