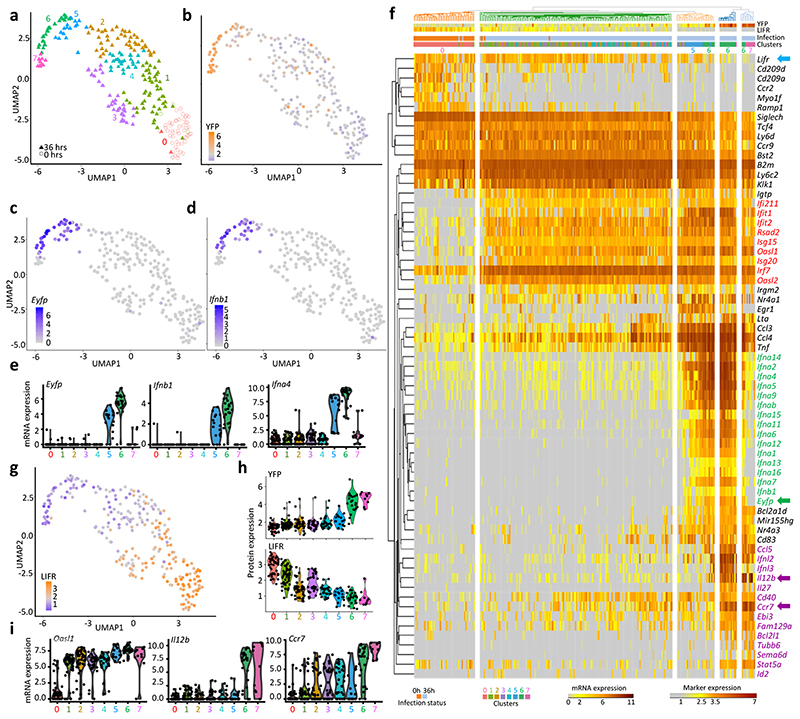
Fig. 3. scRNAseq analysis identifies 8 different pDC activation states in vivo during MCMV infection.
a, Dimensional reduction performed using the UMAP algorithm, and graph-based cell clustering, for 264 bona fide pDCs isolated from one control and one 36h MCMV-infected mice (SS2 dataset#2). b, Inverse hyperbolic arcsine (asinh) fluorescence intensity of YFP projected on the UMAP space. c-d, Expression of Yfp and Ifnb1 on the UMAP space. e, Violin plots showing mRNA expression profiles of selected genes across all individual cells and in comparison between the clusters identified in (a), cluster 0= UN pDCs, clusters 1-4= MCMV Eyfp –YFP– pDCs, cluster 5= MCMV Eyfp+YFP– pDCs, cluster 6= MCMV Eyfp+YFP+ pDCs, cluster 7= MCMV Eyfp–YFP+ pDCs. f, Heatmap showing mRNA expression levels of selected genes (rows) across individual pDCs (columns), with hierarchical clustering using one minus Spearman rank correlation for cells and Kendall’s tau distance for genes. The top differentially expressed genes between Seurat clusters are shown, as well as representative ISG and pDC-specific genes. B2m was included as an invariant control housekeeping gene. YFP and LIFR protein fluorescence intensities, obtained from index sorting data, are also shown on the top of the heatmap, as well as the infection status of the mice from which the pDCs were isolated, and the belonging of individual pDCs to the Seurat cell clusters. g, LIFR expression intensity projected on the UMAP space. h, Violin plots showing asinh fluorescence intensity of EYFP and LIFR across Seurat clusters. i, Violin plots showing mRNA expression profiles of selected genes across Seurat clusters.

