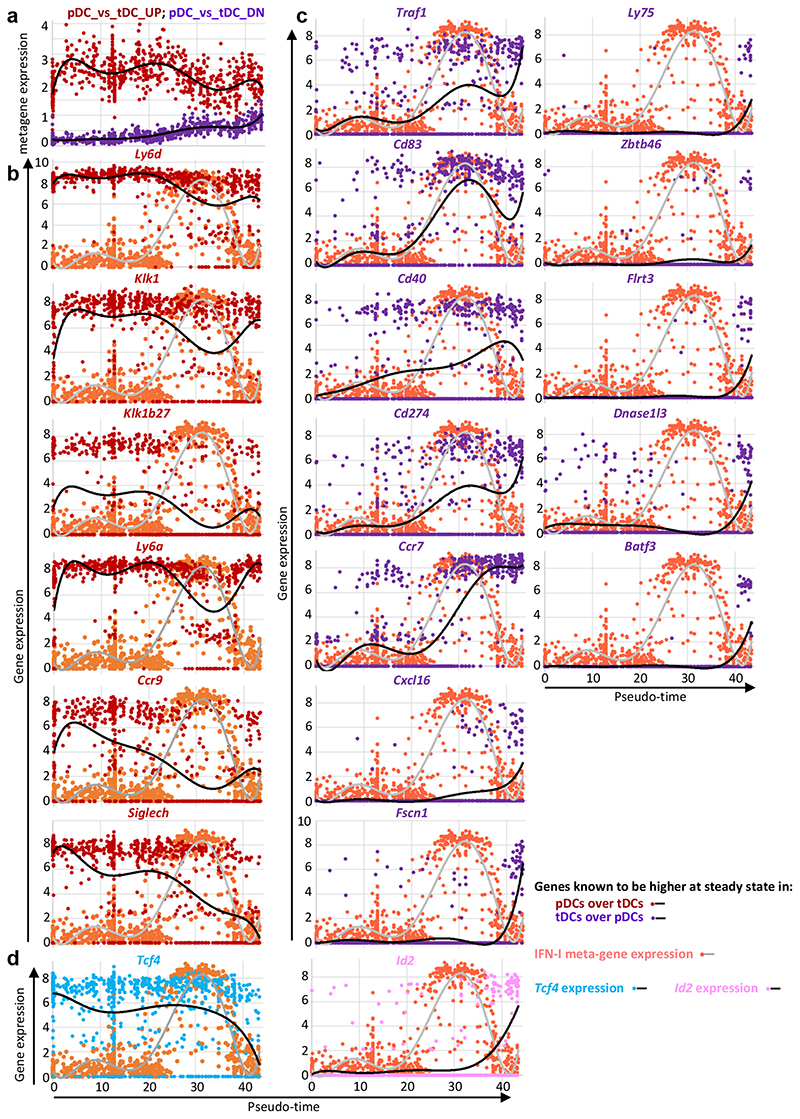
Fig. 5. Transcriptional convergence of pDCs towards tDCs over pseudo-time.
a, Meta-gene expression levels (y-axis) along pseudo-time (x-axis), in the FB5P kinetic dataset, for genes higher in steady state pDCs over tDCs (pDC_versus_tDC_UP gene set, dark red dots and upper black curve) and for the genes lower in steady state pDCs as compared to tDCs (pDC_versus_tDC_DN gene set, violet dots and lower black curve). Individual cells are shown as dots and a polynomial curve was fit to the data. The gene sets were generated by reanalyzing public data (GEO Series GSE76132, see Supplementary Data 2). b, Expression level along pseudo-time of representative individual genes of the pDC_versus_tDC_UP gene set. c, Expression level along pseudo-time of representative individual genes of the pDC_versus_tDC_DN gene set. d, Expression level along pseudo-time of the pDC master transcription factor Tcf4 (blue dots and black curve) and of its counter-regulated cDC1 master transcription factor Id2 (pink dots and black curve). The expression of the IFN-I meta-gene is shown on each graph for comparison (pale red dots and gray curve).

