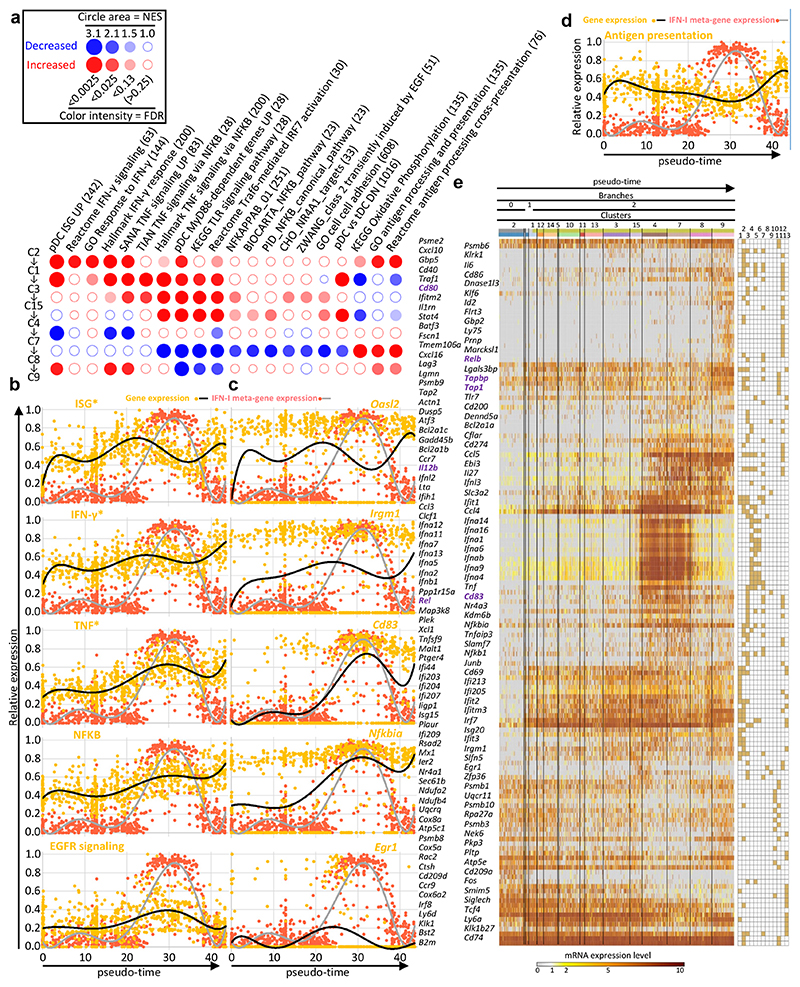
Fig. 6. Identification of annotated gene modules regulated along pseudo-time during pDC activation.
a, BubbleMap showing the gene sets with the most relevant and significant enrichment patterns along the pseudo-time of pDC activation trajectory. Dark red bubbles represent significant increased expression of the gene set (columns) across two consecutive pDC clusters along pseudo-time (rows). Dark blue bubbles represent significant decreased expression. Empty bubbles correspond to lack of significant differences in gene set expression between the pDC clusters compared. Hence, the expression pattern of each gene set along pseudo-time is visualized as a vertical succession of red or blue bubbles. b,c Normalized expression level (y-axis) along pseudo-time (x-axis) of the meta-genes corresponding to the selected gene sets (left) and of one of their representative genes (right) (pale orange dots and black curves). The expression of the IFN-I meta-gene is shown on each graph for comparison (pale red dots and gray curve). d, Normalized expression level (y-axis) along pseudo-time (x-axis) of the metagene corresponding to the antigen presentation gene set, vs the IFN-I meta-gene. e, Heatmap showing the expression patterns along pseudo-time of individual genes selected from the analysis illustrated on panel (a), with hierarchical clustering of the genes using one minus Pearson correlation as distance metric. Belonging of the genes to the gene sets illustrated in a-c is shown in the grid on the right of the heatmap, with gene set 1, ISG; 2, IFN-γ responsive genes; 3, TNF signaling pathway and responsive genes; 4, pDC Myd88-dependent genes UP; 5, KEGG TLR signaling pathway; 6, Reactome Traf6-mediated IRF7 activation; 7, NFKB signaling pathways and responsive genes; 8, Zwang class 2 transiently induced by EGF; 9, CHO NR4A1 targets; 10, KEGG Oxidative phosphorylation; 11, GO antigen processing and presentation; 12, pDC_versus_tDC_DN; 13, pDC_versus_tDC_UP.

