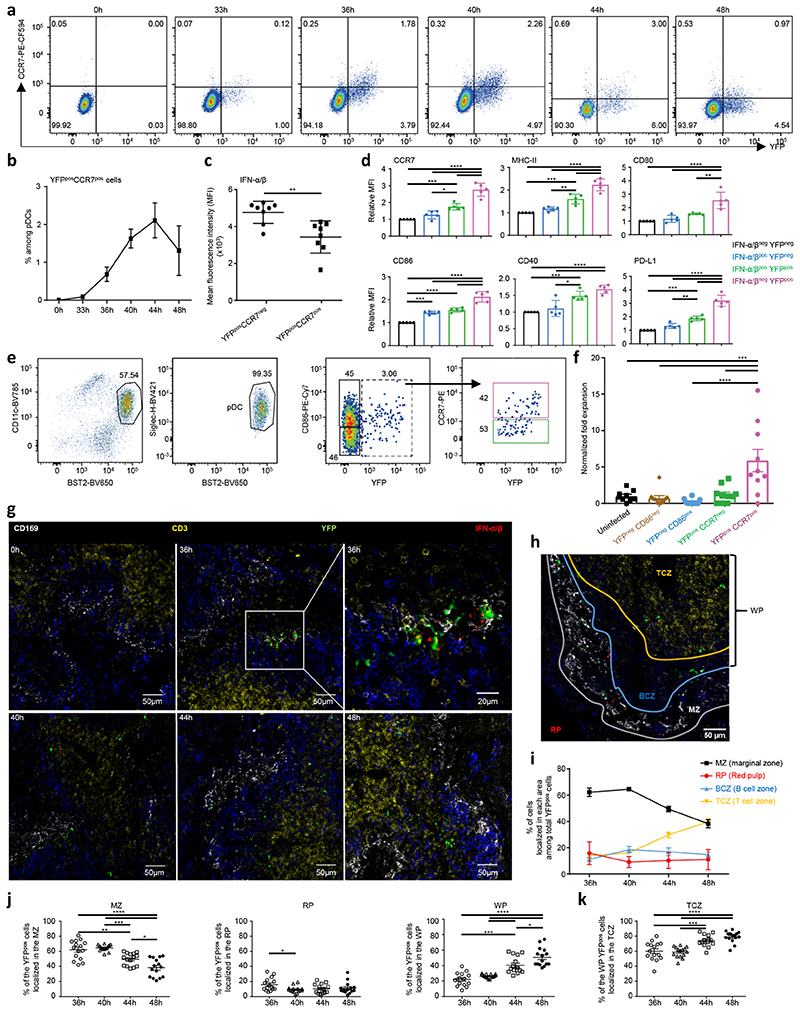
Fig. 8. Characterization of the phenotype, function and micro-anatomical location of pDC activation states.
a, YFP vs CCR7 expression in splenic pDCs during MCMV infection. Data from one representative Ifnb1Eyfp mouse is shown for each time points. b, Frequency of YFP+CCR7+ cells within splenic pDCs during MCMV infection. The data represent individual mice with n = 5 at 0h, 7 at 33h, 10 at 36h, 5 at 40h, and 3 at 44h and 48h, from one experiment for 44h and 48h, and pooled from 2 (resp. 3) independent experiments for 33h and 40h (resp. 0h and 36h). c, Mean fluorescence intensity of IFN-α/β on YFP+CCR7+ vs YFP+CCR7− pDCs isolated from 36h MCMV-infected mice. d, Relative median fluorescence intensity (MFI) of indicated markers on pDC subpopulations isolated from 36h MCMV-infected Ifnb1Eyfp mice. The data in c and d are from n = 10 (resp. 5) mice from two independent experiments (c) or one experiment representative of two (d). e, Flow cytometry sorting strategy for splenic pDC subpopulations from uninfected (UN) or 38h MCMV-infected Ifnb1Eyfp mice, starting from live single CD11bneg Linneg cells. f, Expansion of naïve CD4 OT-II cells upon co-culture with the indicated OVA peptide-pulsed pDC subpopulations. The graph shows individual data points pooled from 3 independent experiments, each with 2-4 replicate co-cultures for each pDC subpopulation. g, Immunohistological analysis of spleen sections from uninfected (UN) or MCMV-infected Ifnb1Eyfp mice harvested at the indicated time points. Top right image, 5x zoom of the region delimited in the previous image. h, Definition of spleen zones for cell quantification (see online methods). i, Distribution of YFP+ cells across the different spleen zones during the course of MCMV infection. j, Detail of the individual data collected and used for generating the graph of panel I. k, A similar analysis was performed as in panel (j) for the percentages of WP YFP+ pDCs residing in the TCZ. For g-k, data were analyzed from 3 different mice, with 5 different whole splenic sections per mouse (i.e. 15 images per time point). In b-d,f,i-k, data are shown as mean±s.e.m. and P values are from One-way ANOVA with Tukey’s post hoc test, with *p<0.05, **p<0.01, ***p<0.001, ***p<0.0001.

