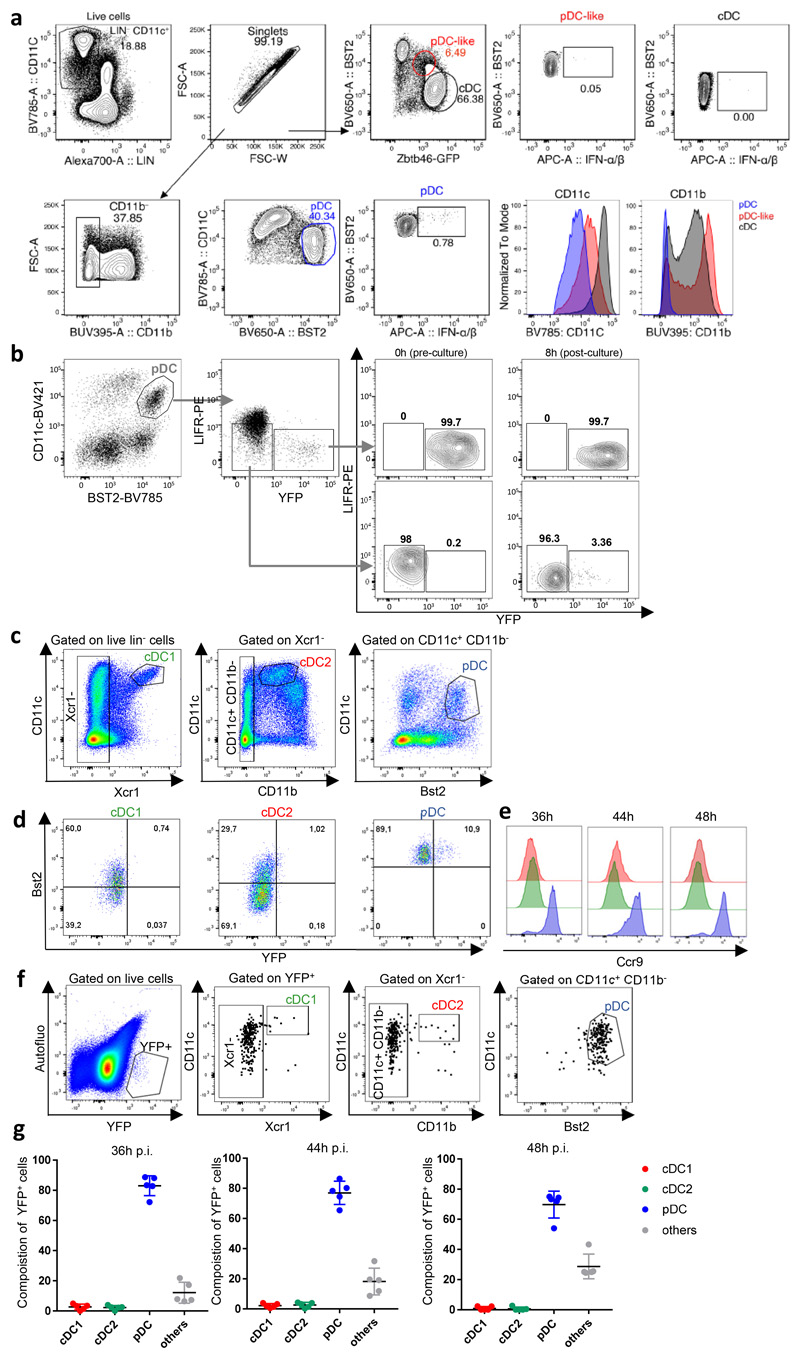
Extended Data Fig. 1. Validation of the Ifnb1Eyfp reporter mice to track IFN-I-producing pDCs during MCMV infection.
a, IFN-α/β production by pDCs (blue), pDC-like cells (red) and cDCs (black) at 36h after MCMV infection of Zbtb46GFP reporter mice. Overlaid histograms (bottom right) show CD11c and CD11b expression for the three cell types. The data shown are from one mouse representative of 3 animals from 2 independent experiments. b, YFP expression in pDCs is stable during the biological process examined. Ifnb1 EYFP CD45.2+ mice were infected by MCMV. 36h later, LIFRlo EYFP- or LIFRlo EYFP+ pDCs were sorted by flow cytometry and cultured in vitro for 8h in CD45.1+ feeder FLT3-L bone marrow cultures. YFP expression was monitored by flow cytometry before and after the culture as indicated. The data shown are from one experiment representative of two independent ones. c-g Around 80% of splenic YFP+ cells are bona fide pDCs at all time points examined during MCMV infection. c, cDCs and pDCs were identified following the gating strategy shown. The analysis was performed after selection of live cells and exclusion of Lin+ cells. d, YFP expression was analyzed in indicated splenic DC populations, isolated from 44h MCMV-infected Ifnb1Eyfp mice. e, Ccr9 expression was analyzed in splenic cDC1s (red), cDC2s (green) and pDCs (blue) isolated from 36h (left), 44h (middle) or 48h (right) MCMV-infected Ifnb1Eyfp mice. f, Autofluorescence-YFP+ cells were gated in live splenocytes isolated from 44h MCMV-infected Ifnb1Eyfp mice. The proportions of DCs vs non-DCs (others, grey) in YFP+ cells were analyzed according to the gating strategy shown in (c). g, Summary of the results obtained following the strategy shown in (e) at 36h (left), 44h (middle) and 48h (right) post-infection. For each time point, data (mean ± s.e.m.) are shown for 5 mice from one experiment.

