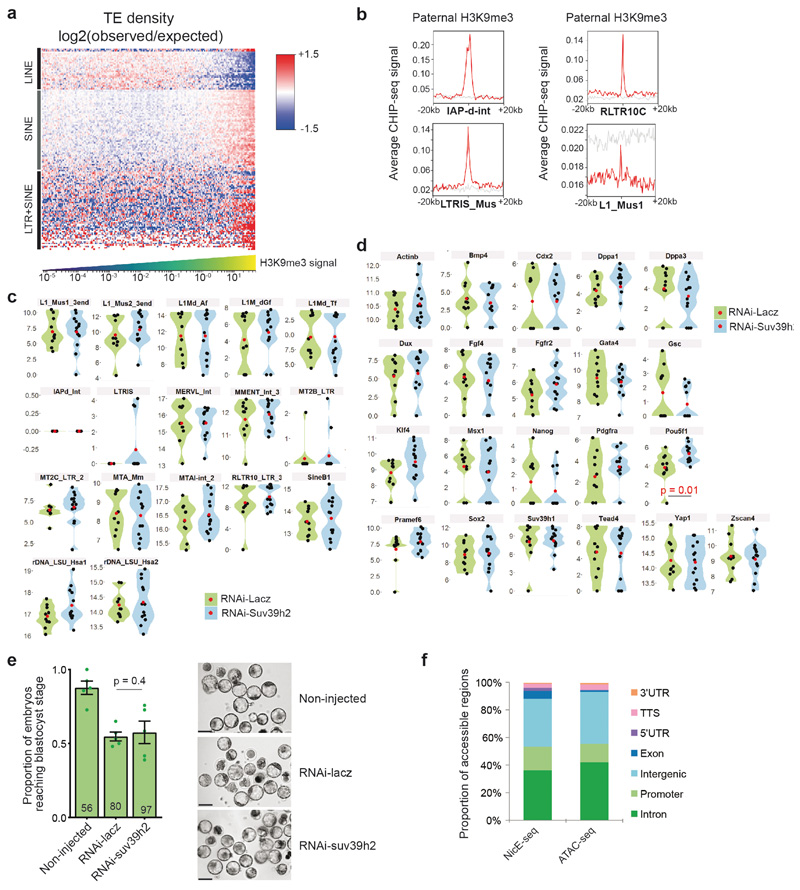
Extended Data Fig. 3. H3K9me3 is compatible with gene expression during early preimplantation development.
a. Enrichment heatmap (log 2 observed/expected TE density) in regions with differing paternal H3K9me3 levels. Columns correspond to 10kb binned genomic regions sorted from left to right by increasing H3K9me3 levels. Rows correspond to individual TE types hierarchically clustered using the centroid linkage method. Clusters are coarsely annotated with the dominant TE families. H3K9me3 Chipseq data from12 was reanalyzed for panels a and b.
b. Examples of paternal H3K9me3 levels in a 40kb region around selected TE classes (red line, 5% trimmed mean; grey, randomized signal).
c-d. Violin plots showing relative expression values of the indicated repetitive elements (c) or genes (d) in knockdown of Suv39h2 against control (Lacz) knockdown embryos at the 2-cell stage (46h post-hCG). The mean expression value of n = 10 embryos (control) and n = 13 embryos (Suv39h2 knockdown) from 3 independent experiments is depicted as a red point and the individual expression in each embryo as black dots. Statistical analysis was performed using the two-sided Mann-Whitney U test. See Table S4 for a list of genes (sheet1), REs (sheet2), and for the genes Taqman® assay IDs and reason(s) for inclusion.
e. Shown is the mean (± S.E.M.) proportion of embryos that reached the blastocyst stage 3 days after microinjection (n = the total number of embryos analysed is indicated from 5 independent experiments). Statistical analysis was performed using the N-1 Chi-squared test for comparing independent proportions. On the right are shown representative brightfield images of embryos. Images were taken at 120h post-hCG injection. Scale bar 100 μm.
f. Comparison of the genomic distribution of open chromatin identified by NicE-seq compared to ATAC-seq in 8-cell stage mouse preimplantation embryos. Statistical source data are shown in Source data extended data fig. 3.

