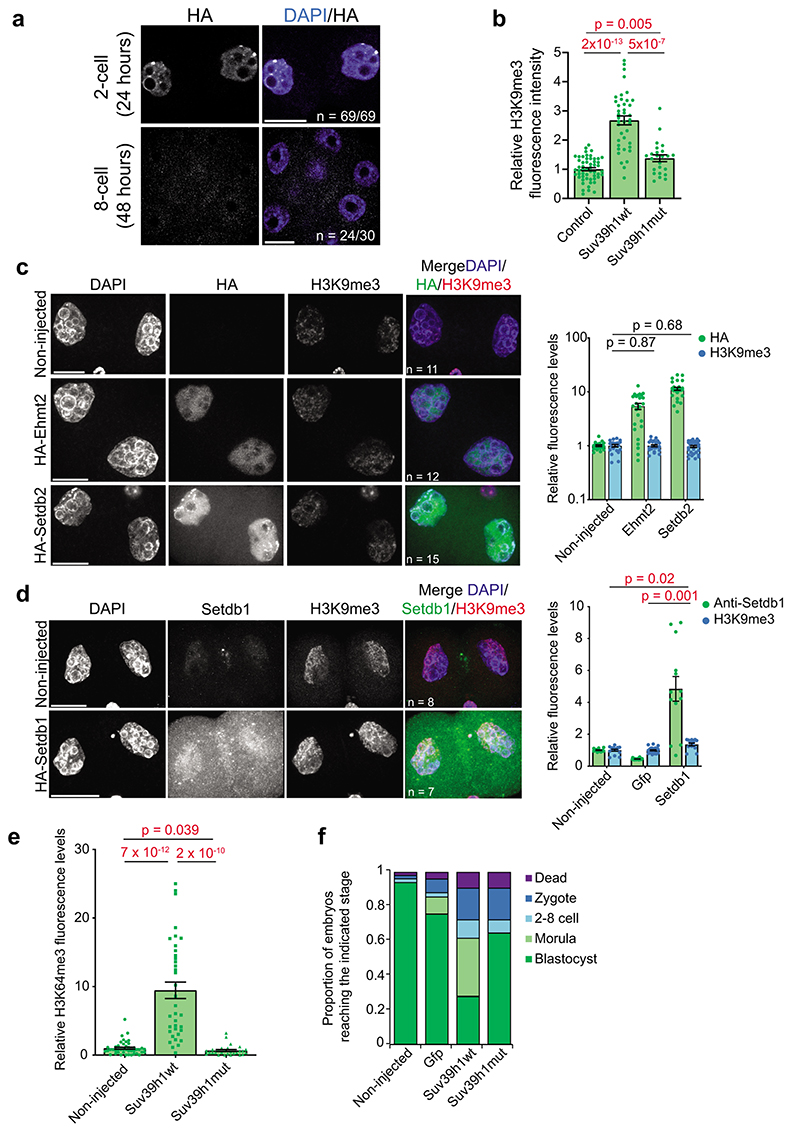
Extended Data Fig. 4. Suv39h1 induces constitutive heterochromatin.
a. Zygotes were microinjected with HA-Suv39h1 mRNA, cultured for 24 or 48 hours, fixed and immunostained with an anti-HA antibody. A representative full z-series projection from at least 3 independent experiments is shown. Scale bar 10 μm.
b. Mean levels of H3K9me3 (±S.E.M) in 2-cell embryos (42-44h post-hCG). Confocal stacks were reconstructed with IMARIS and nuclei were segmented using the DAPI channel. Fluorescence intensity was quantified in each nucleus after background subtraction. N = numbers as in Fig.4d. Statistical analysis was performed using the two-sided Mann-Whitney U test.
c. Zygotes were microinjected with Ehmt2 (G9a) or Setdb2 mRNA, fixed at the 2-cell stage (42-44h post-hCG) and immunostained with anti-H3K9me3 and anti-HA antibodies. A representative full z-series projection is shown. Mean fluorescence levels (± S.E.M.) are shown on the right (n = the total number of embryos analysed as indicated on the left panels across 2 independent experiments). Statistical analysis was performed using the Mann-Whitney U test. Scale bar 20 μm.
d. As in c but with Setdb1 mRNA. Mean fluorescence levels (± S.E.M.) are shown on the right (n = the total number of embryos analysed as indicated on the left panels across 2 independent experiments). Statistical analysis was performed using the two-sided T test. Scale bar 20 μm.
e. Mean levels (± S.E.M) of H3K64me3 in 2-cell stage embryos (42-44 hours post-hCG injection) after Suv39h1wt or Suv39h1mut expression. N = total number of embryos analysed is show in fig. 4h across 5 independent experiments for Suv39h1wt and 4 for Suv39h1mut. Statistical analysis was performed using the two-sided Mann-Whitney U test.
f. Summary of the stages of development for which embryos arrested as described in Fig.5b. N = numbers as in fig. 5b. Statistical source data are shown in Source data extended data fig. 4.

