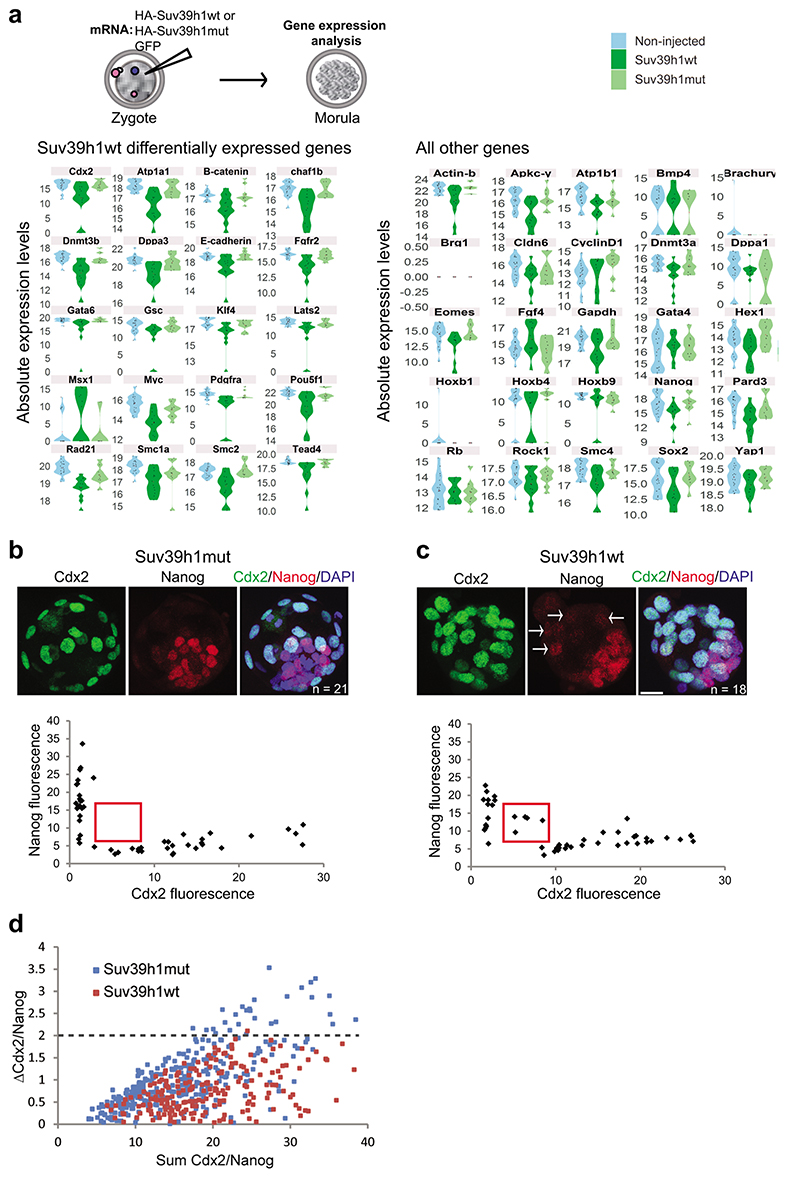
Extended Data Fig. 5. Suv39h1 compromises development.
a. Violin plots depicting absolute expression levels (log2 scale) in single Suv39h1wt, Suv39h1mut-expressing embryos and non-injected controls at the morula stage (78 hours post-hCG). Expression values in individual embryos are indicated by black points and the mean by a red point. Genes with a significant difference (P < 0.05; two-sided Mann-Whitney U test) between the Suv39h1wt group and both control groups are shown on the left. N = numbers and stages of the embryos acquired from 3 independent experiments are shown in Table S5 and a list of genes analysed are shown in Table S6.
b-c. Embryos injected with mRNA encodinb Suv39h1mut (control) or (c) Suv39h1wt were cultured to the blastocyst stage, fixed and immunostained with the indicated antibodies. Shown are representative full z-series projections. N = number of embryos analyzed from 2 independent experiments is indicated. Scale bar 20 μm. Arrows in Nanog panel in c indicate cells ectopically expressing low levels of NANOG. The graphs below show the levels of NANOG and CDX2 in individual nuclei, for the representative embryos above. A clear segregation of CDX2 or NANOG positive populations is apparent in the controls, but is less pronounced in the Suv39h1wt-injected embryos. The red box indicates a consistent population of double CDX2/NANOG positive cells present in Suv39h1wt embryos only.
d. The absolute difference in intensity (ΔCdx2/Nanog) for each nucleus (plotted points) from the embryos classified as blastocysts (>32 cells) plotted against the sum of the NANOG and CDX2 signal (n = 7 embryos for Suv39h1mut and 5 for Suv39h1wt across 2 independent experiments). Fewer nuclei have high ΔCdx2/Nanog and more nuclei have high sum Cdx2/Nanog scores in the Suv39h1wt embryos, suggesting a defect in the resolution of the outer and inner lineages. Statistical source data are shown in Source data extended data fig. 5.

