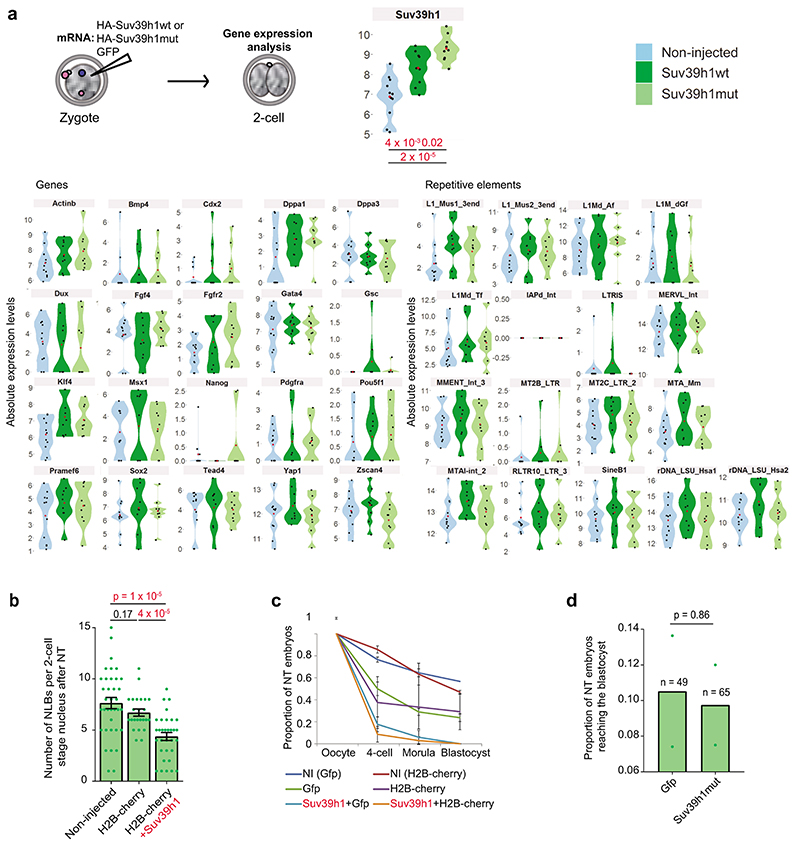
Extended Data Fig. 6. Suv39h1 inhibits epigenetic reprogramming.
a. Violin plots depicting absolute expression levels in log2 scale in single Suv39h1wt, Suv39h1mut-expressing embryos and non-injected controls at the late 2-cell stage (46 hours post-hCG). N = 9, 9 and 11 single embryos respectively across 3 independent experiments. Expression values in individual embryos are indicated by black points and the mean by a red point. The only gene or RE displaying significant difference using the two-sided Mann-Whitney U test between groups is Suv39h1 itself. See Table S4 for a list of genes (sheet1), REs (sheet2), and for the genes Taqman® assay IDs and reason(s) for inclusion.
b. The mean number of nucleolar-like bodies (NLBs) (± S.E.M.) inside each 2-cell stage nucleus from confocal stacks of DAPI stained embryos was counted manually (n = the number of embryos analyzed is indicated across 4 independent experiments). Nuclear transfer embryos were fixed at 25 and 33 hours post-activation with similar results obtained at the two time points. Statistical testing was performed using the two-sided Mann-Whitney U test for comparing nonparametric distributions.
c. Shown is a summary of the developmental progression of nuclear transfer embryos microinjected with the indicated mRNAs according to the workflow in Fig.7a. Developmental progression was monitored daily and the proportion of embryos that reached each stage of development was calculated. The data represents the mean (±S.E.M) (n = the total number of embryos analysed as indicated in Fig.7c across 3 independent experiments except for H2B-cherry alone, which was done twice.
d. The mean proportion of embryos injected with Suv39h1mut or GFP developing to the blastocyst stage is shown. N = the number of embryos tested across 2 independent experiments is indicated on the graph. Statistical analysis was performed using the N-1 Chi-squared test for comparing independent proportions. Statistical source data are shown in Source data extended data fig. 6.

