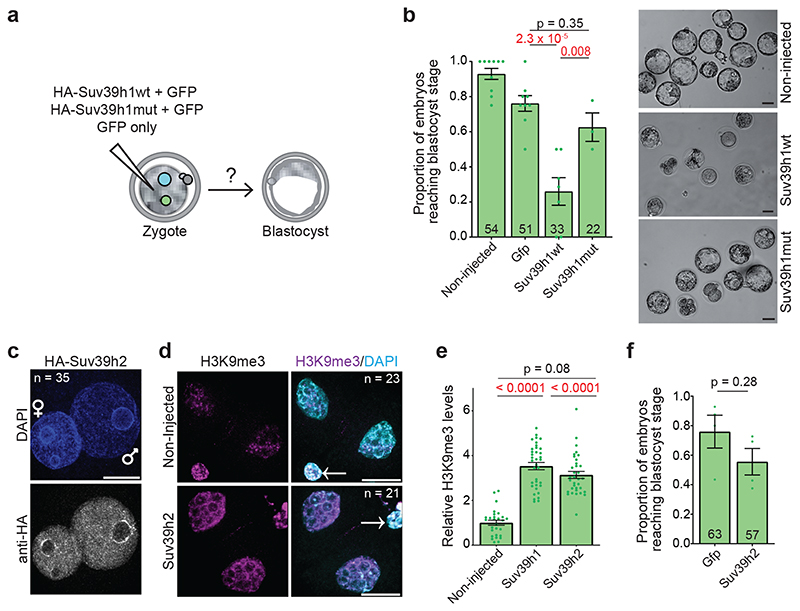
Figure 5. Suv39h1 compromises development.
a. Diagram showing the experimental design.
b. The proportion of embryos that reached the blastocyst stage 72 hours after microinjection. Data show represent mean ± S.E.M. (n = the total number of embryos analysed as indicated on the graph across 6 independent experiments for Suv39h1wt and 3 independent experiments for Suv39h1mut). Statistical analysis was performed using the N-1 Chi-squared test for comparing independent proportions. On the right are shown representative brightfield images of embryos injected at the zygote stage with Suv39h1wt or mut mRNA and cultured to the blastocyst stage (72h after microinjection). Scale bar 50 μm.
c. A representative full z-series confocal projection of 35 zygotes injected with HA-Suv39h2 mRNA, fixed and immunostained with anti-HA 8 hours later from 3 independent experiments. Scale bar 10 μm.
d. Zygotes were microinjected with HA-Suv39h2 mRNA and fixed at the 2-cell stage, 24 hours after microinjection and immunostained with an anti-H3K9me3 antibody. A representative full z-series confocal projection is shown from 3 independent experiments (n refers to the total number of embyros analysed). Scale bar 20 μm. Where visible, the polar body is indicated by an arrow in the merge panel.
e. Mean levels of H3K9me3 in the 2-cell stage embryo after Suv39h1wt or Suv39h2 mRNA injection for the embryos represented in d. Error bars represent S.E.M. (n = the total number of embryos analysed as indicated in d across 3 independent experiments). Statistical analysis was performed using the unpaired students T test
f. The proportion of embryos that reached the blastocyst stage 72 hours after microinjection. Data show represent mean ± S.E.M. (n = the total number of embryos analysed as indicated on the graph across 4 independent experiments). Statistical analysis was performed using the N-1 Chi-squared test. Statistical source data are shown in Source data fig. 5.

