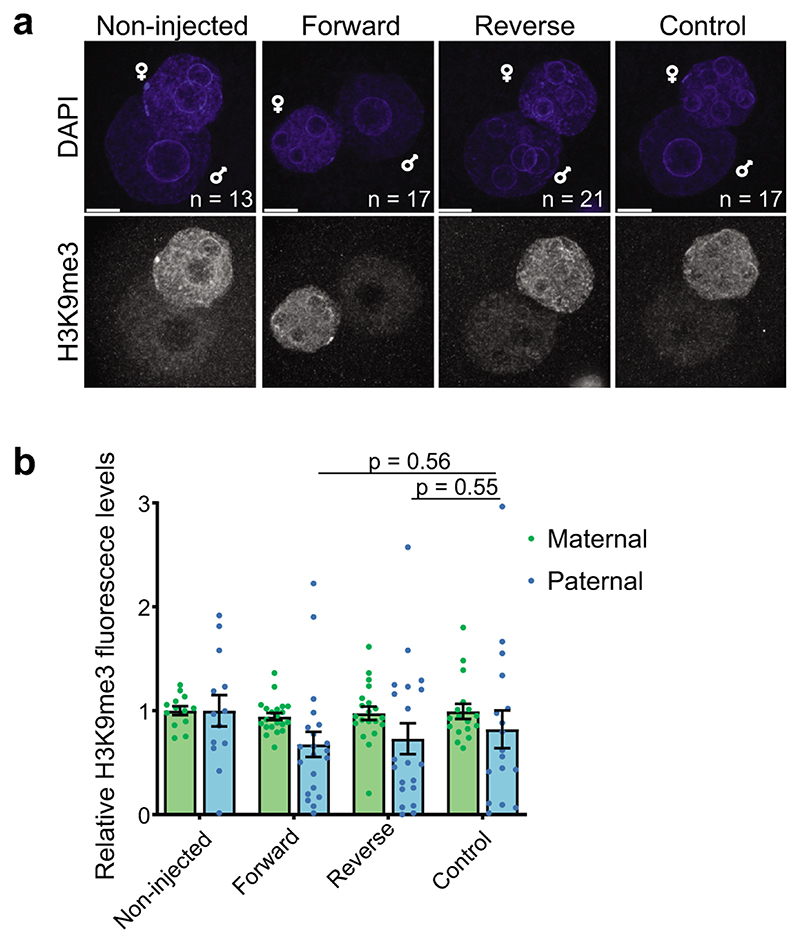
Extended Data Fig. 2. RNA modulation of the KMT activity of Suv39h2 attenuates H3K9me3 levels in the early preimplantation mouse embryo.
a. Representative full z-series projections of confocal stacks of the indicated number of embryos manipulated as described in Figure 2d, injected instead with single-stranded forward or reverse major satellite transcripts from 2 independent experiments. Paternal and maternal pronuclei are indicated. Scale bar 10 μm.
b. Quantification of the levels of H3K9me3 staining in the maternal and paternal pronuclei across embryos represented in a. Maternal and paternal H3K9me3 levels were normalized to average levels in non-injected embryo. The graph depicts the mean ± S.E.M. (n = the number of embryos analysed as indicated in a across 2 independent experiments). Statistical analysis was performed using the two-sided Mann-Whitney U test for comparing nonparametric distributions. Statistical source data are shown in Source data extended data fig. 2.

