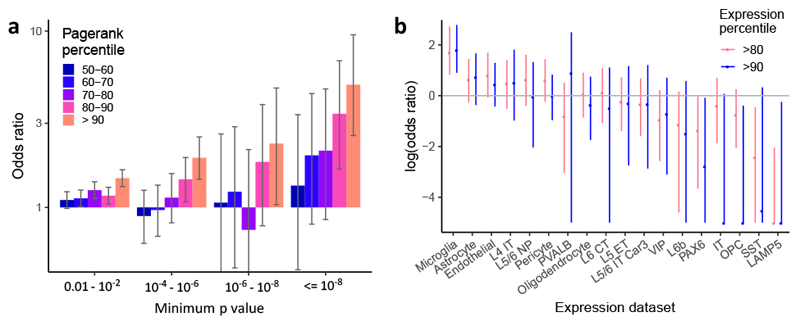
Figure 5. Genome-wide network and gene expression enrichments.
a, Enrichment of low GWAS P values within 10 kb of genes having high vs. low network pagerank percentile (low defined as below 50th percentile). Whiskers represent 95% confidence intervals based on Fisher’s exact test for n = 18,055 genes. b, Enrichment of AD risk near genes with high expression in each brain cell type (above 80th or 90th percentile) relative to the other cell types. Cell types are defined based on single-cell clusters defined in Hodge et al.77. Neuronal cells are defined either by cortical layer (L4, L5, L6), and/or by projection target (IT, intratelencephalic; CT, corticothalamic; ET, extratelencephalic-pyramidal tract; NP, near-projecting), or by binary marker genes (LAMP5, PAX6, PVALB, VIP, SST). OPC, oligodendrocyte precursor cells. Whiskers represent 95% confidence intervals as determined by fgwas.

