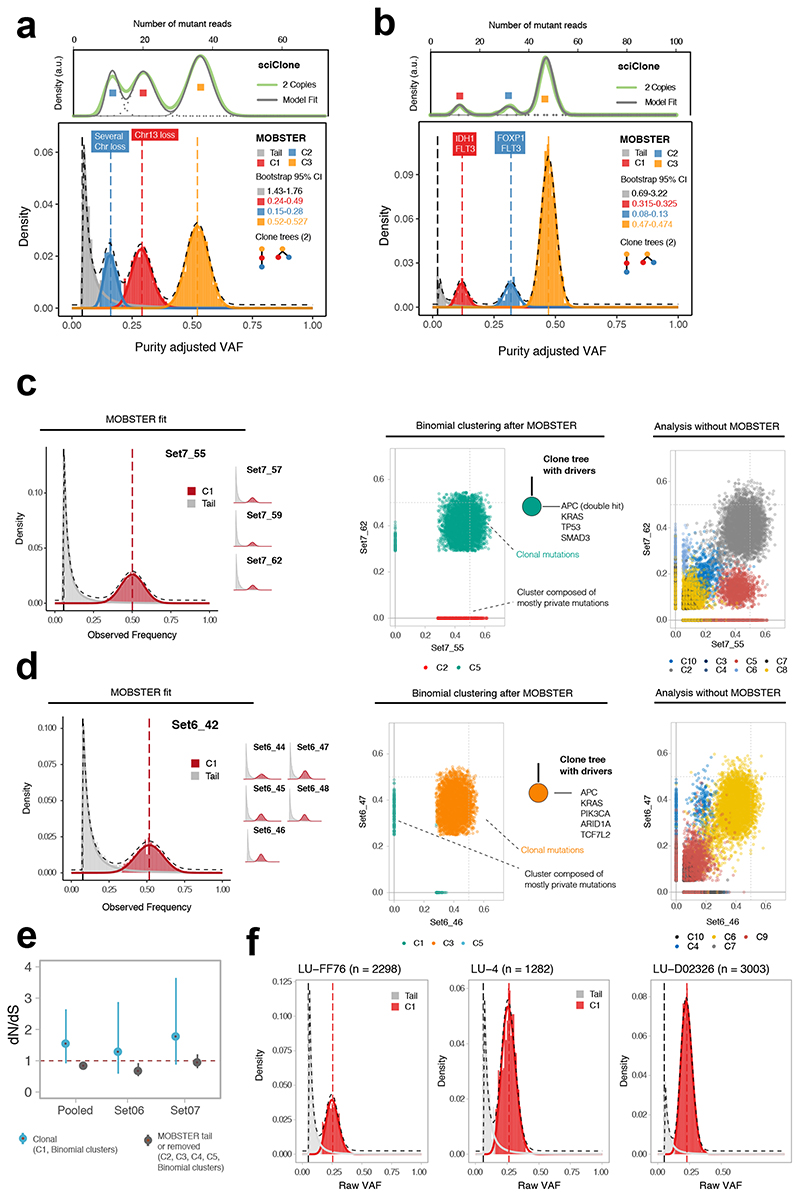
Figure 3. Analysis of single sample and multi-region whole-genome data.
(a) Breast carcinoma ~180x WGS sample from ref3. MOBSTER identified a neutral tail plus k = 3 Beta clusters (2 subclones, consistent with two clone trees). Analysis of non-tail mutations with sciClone confirmed 2 subclones. sciClone without MOBSTER would have fit one extra clone to the tail. Non-parametric bootstrap is used to estimate the 95% bootstrap confidence intervals for the parameters. (b) Leukemia ~320x WGS sample from ref20. MOBSTER found two subclones (k = 3), confirmed with sciClone, and 2 clone trees. (c) WGS data at 100x from 4 biopsies of colorectal cancer Set07. From VAF of diploid mutations we identified neutral tails and no subclonal selection; from non-tail mutations we found 5 clusters (multivariate clustering with α = 10−6, Supplementary Note). C1 is the truncal cluster; all other clusters are enriched mutations private to a biopsy, indicating ancestor effect (Supplementary Note). The clone tree depicts a neutrally expanding tumor with all drivers in the trunk. Analysis without MOBSTER would have inflated the number of subclones (right panel; Supplementary Figures 20-23). (d) WGS data at 100x from 6 biopsies of cancer Set06 also showed neutral subclonal dynamics. Without MOBSTER we would have inflated the number of selected subclones (right panel; Supplementary Figures 24-27). (e) dN/dS analysis for Set06 and Set07 comparing truncal vs subclonal mutations confirmed lack of evidence for positive selection at the subclonal level, corroborating our conclusions. (f) Three lung cancer cases from ref24 sequenced at 100x WGS were consistent with neutral subclonal dynamics.

