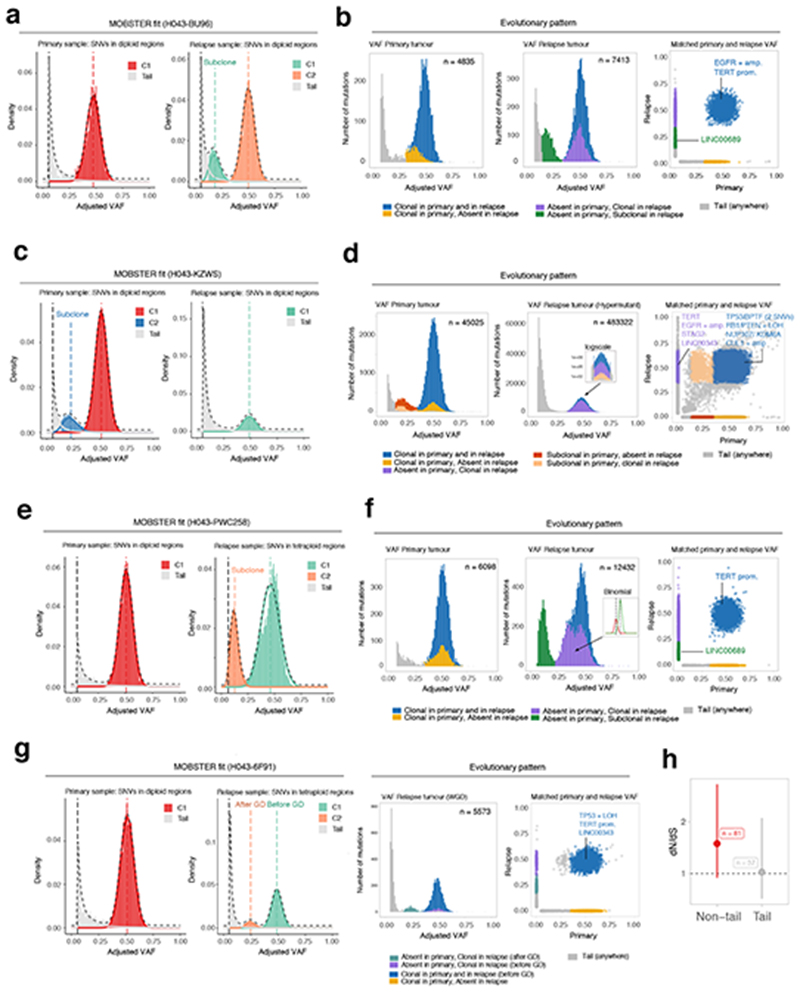
Figure 5. Analysis of longitudinal glioblastoma samples with MOBSTER.
(a). Patient H043−BU96 is one of n = 16 IDH-wildtype glioblastomas for which we analyzed WGS data (~100x) from pre-treatment and post-treatment longitudinal samples previously generated28. (b) Analysis following MOBSTER identified subclones private to the primary (yellow) and relapse (green) tumor respectively, the latter containing a putative driver mutation in LINC00689. (c) Patient H043−KZWs MOBSTER fits. (d) Here a subclone detected in the primary went on to sweep through the relapse, which was hypermutant after temozolomide treatment (zoom-in logscale panel). (e) Patient H043−PWC258 MOBSTER fits. (f) Here the primary sample showed neutral evolutionary dynamics, whereas the relapse contained detectable subclones possibly mixing with the neutral tail. An additional high-frequency subclone was detected from a downstream analysis using Binomial clustering of read counts (purple cluster, split into 2 Binomial components). (g) MOBSTER can also be used to identify and assign clusters that are produced by whole-genome duplications, or more general aneuploid states. In such contexts, we expect to see peaks in the VAF distribution that distinguish mutations that happened before and after genome doubling. In the case of patient H043−6F91, a diploid primary tumor (neutral) became whole-genome duplicated at relapse. (h) Orthogonal dN/dS analysis (point estimate and Confidence Intervals from dndscv) of mutations in 74 putative GBM driver genes assigned to neutral tails versus non-tail provided evidence of selection only in non-tail mtuations. The full list of analyzed cases is available in Supplementary Figure 32.

