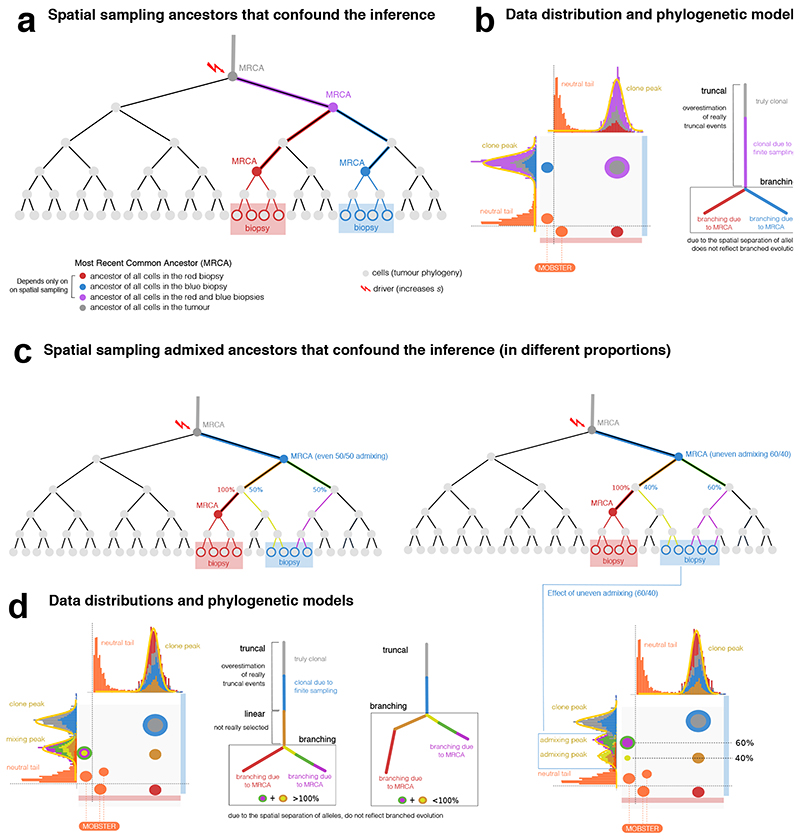
Extended Data Fig. 4. Effects of the MRCA fallacy and the admixing deception in multi-region sequencing data.
(a) Phylogenetic tree of cellular divisions in a neutral expansion, i.e., inside a clonal expansion triggered by a driver hitting the grey cell. The tree shows the sampling of 2 biopsies (red and blue), and the MRCAs. For example, the mutational load present in the red MRCA will characterize cells in the red biopsy. (b) Data distribution and the associated phylogenetic tree show how our estimate of the true evolution of this tumor is confounded by spatial sampling. Mutations that accrue in the lineages from which the MRCAs originate, will create clusters in the data. The corresponding phylogenetic model will also show an inflated number of clonal events (purple MRCA), and branches that do not represent real selection-driven branched evolution (red and blue MRCAs). (c) Example admixing deception in the blue biopsy, where two independent lineages are represented. Admixing can be even or uneven, depending on the proportion of lineages (left versus right) in the biopsy. Remark that no subclonal selection is at play in this example. (d) If we sequence the above biopsies, we find truncal mutations (gray and blue), and a number of clusters that look like genuine subclones. The admixing effect is observed on the vertical of the blue biopsy. In the even case (50% each), the admixing generates one 50% peak for both independent lineages. According to the relation between the frequencies of the observed ancestors, we can also fit two different trees to data; notice that the branching structure presented in both of them is the result of the confounders and does not reflect actual branched evolution. In the uneven case (60% versus 40%), the two admixing peaks separate, originating 2 peaks hitting at the frequencies of 40% and 60%. This shows the pervasive effect of admixing, with up to 8 clusters in this simple scenarios.

