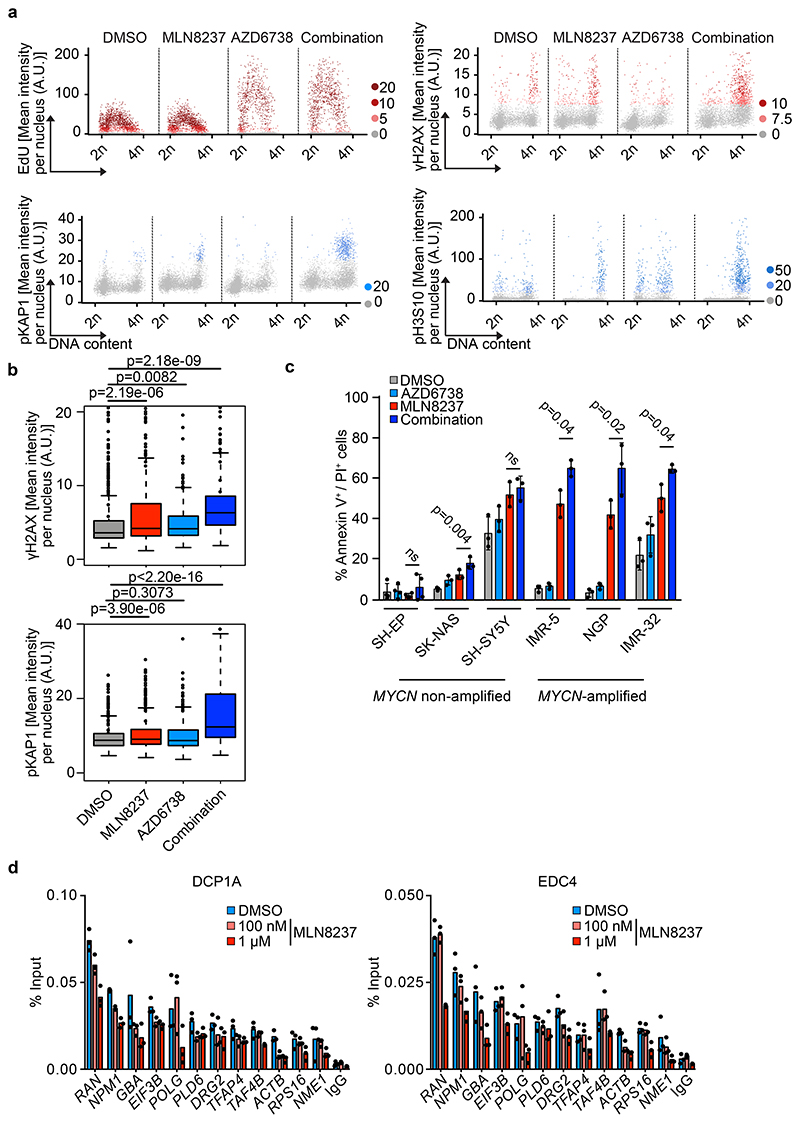
Figure 4. Aurora-A/ATR inhibition induces DNA damage.
a. High-content microscopy-based analysis of MYCN-amplified NGP cells treated for 8 h with 100 nM MLN8237, 1 μM AZD6738 or a combination and assessed for EdU incorporation, γH2AX, pKAP1 and pH3S10. Each dot represents a single cell and is color-coded according to mean fluorescent intensity (n≥3,837 cells were examined over 3 independent experiments). A.U. arbitrary units. Quantification is shown in (b).
b. Quantification of γH2AX (upper panel) and pKAP1 (lower panel) signals shown in (a) (n≥3,837 cells were examined over 3 independent experiments).
c. Annexin-V/PI FACS of the indicated cell lines (MYCN non-amplified: SH-EP, SK-NAS, SH-SY5Y; MYCN-amplified: IMR-5, NGP, IMR-32) treated for 48 h with DMSO, MLN8237 (100 nM), AZD6738 (1 μM) or both. Shown is the mean ± S.D., p-values were calculated using paired two-tailed t-test (n=3).
d. DCP1A (left) and EDC4 (right) ChIP at indicated loci after 4 h of 100 nM or 1 μM MLN8237 treatment in S phase synchronized IMR-5 cells. IgG control was used as control for antibody specificity. Data are presented as mean ± S.D. of technical triplicates from a representative experiment (n=3).

