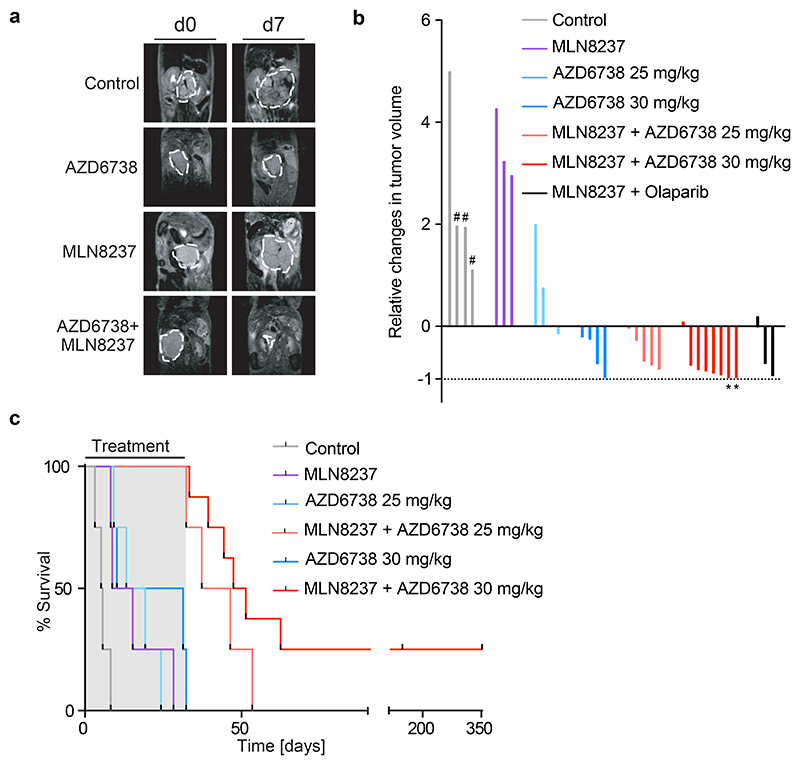
Figure 6. Therapeutic efficacy of combined Aurora-A/ATR inhibitor treatment.
a. Representative MRI sections of mice at day 0 and day 7 of treatment with vehicle, MLN8237 (15 mg/kg), AZD6738 (25 mg/kg) or both. Dashed white lines indicate tumor circumference.
b. Waterfall plot showing relative changes in tumor volume during the first seven days of the beginning of treatment with indicated drugs. Control animals marked with hash (#) show measurement at day 4. Mice which survived the treatment for up to 150 days are marked with an asterisk (*).
c. Kaplan Meier survival curve of TH-MYCN mice treated as indicated. AZD6738 was administered at 25-30 mg/kg every day and MLN8237 at 15 mg/kg on a 5 days on, 2 days off schedule. Shaded area indicates duration of the combination treatment (ended at 32 days, 56 doses) (n=8 animals for MLN8237 + AZD6738 (30 mg/kg), n=4 for all other experimental cohorts). P-values are shown in Extended Data Figure 5g.

