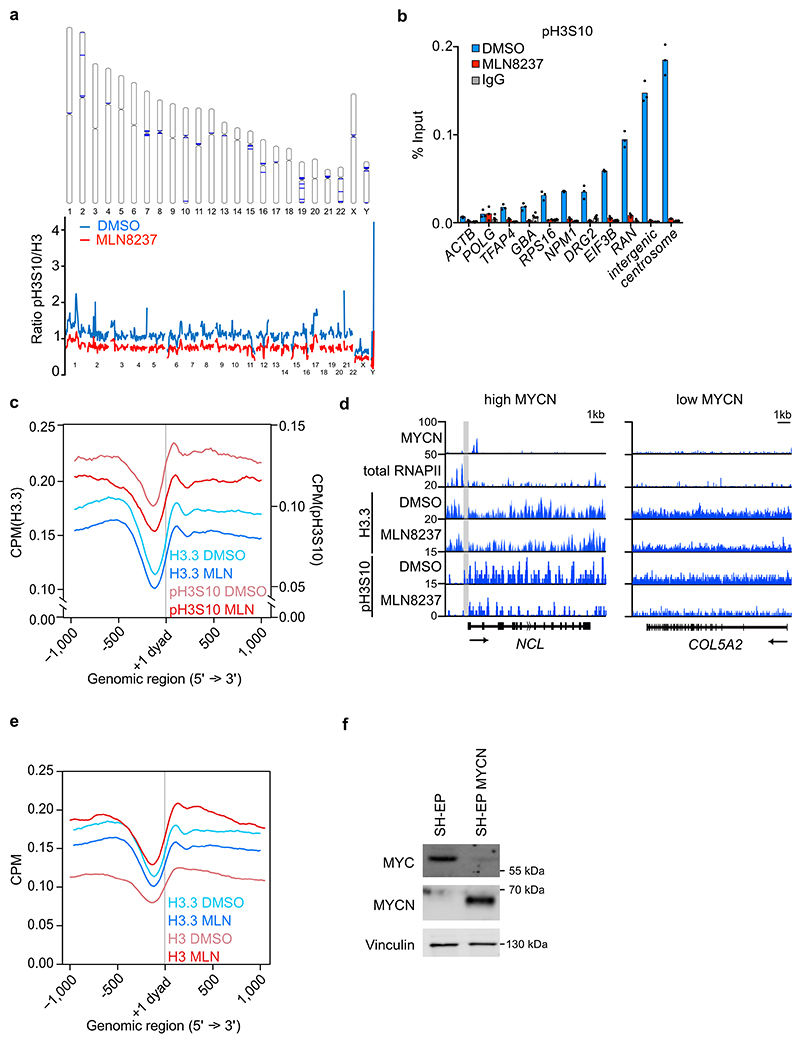
Extended Data Figure 2. Effects of Aurora-A inhibition on H3.3 and pH3S10.
a. (Top): Ideogram illustrating the 50 bins with the strongest reduction in pH3S10 MLN8237 as compared to pH3S10 DMSO (blue rectangles). (Bottom): Levels of pH3S10 relative to total H3 along all chromosomes of S phase-synchronized IMR-5 cells treated for 4 h with 1 μM MLN8237 (red line) and DMSO (blue line) (n=2 independent experiments).
b. pH3S10 ChIP at indicated loci in S phase synchronized IMR-5 cells treated for 4 h with 1 μM MLN8237. IgG control was used as control for antibody specificity. Data are presented as mean of technical triplicates Data representative of 3 independent experiments with similar results
c. Metagene plot of ChIP-Rx signal for histone H3.3 and pH3S10 in S phase-synchronized IMR-5 cells treated for 4 h with MLN8237 (1 μM) or DMSO. The graph is centered on the first nucleosome (“+1 dyad”) downstream of the TSS for N=14,340 genes. (n=2 independent replicates).
d. Browser tracks of MYCN, total RNAPII, H3.3 and pH3S10 of ChIP-Rx at a MYCN high (left) and low (right) bound locus. Nucleosome-free zone is indicated in grey.
e. Metagene plot of ChIP-Rx signal for histone H3 and histone H3.3 in S phase-synchronized IMR-5 cells treated for 4 h with 1 μM MLN8237 or DMSO. The signal is centered on the first nucleosome (“+1 dyad”) located downstream of the TSS for N=14,340 genes (n=3 independent experiments).
f. Immunoblot of asynchronous SH-EP and SH-EP MYCN cells. Vinculin was used as loading control. Data representative of 3 independent experiments with similar results.

