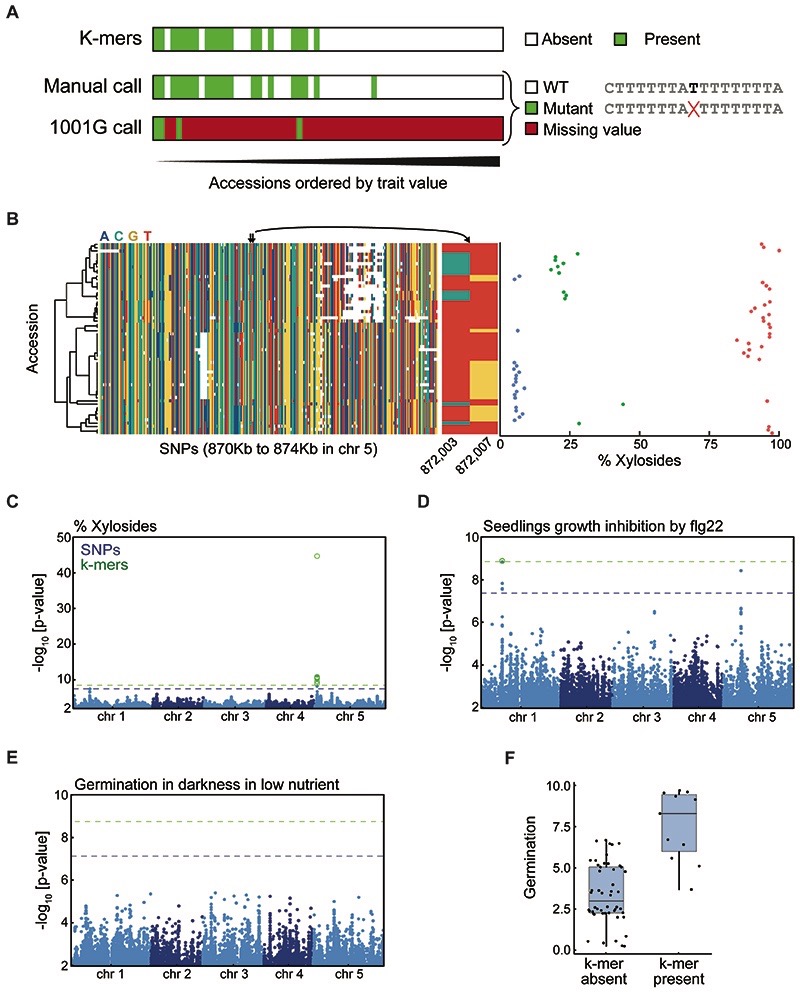
Extended Data Fig. 6. Comparison of SNP- and k-mer-GWAS on phenotypes from 104 studies on A. thaliana accessions.
(A) Histogram of the number of identified k-mers vs. identified SNPs (in log2) for A. thaliana phenotypes. Only the 458 phenotypes with both variant types identified were used.
(B) Histogram of thresholds difference of k-mers vs. SNPs of all A. thaliana phenotypes. Thresholds were -log10 transformed.

