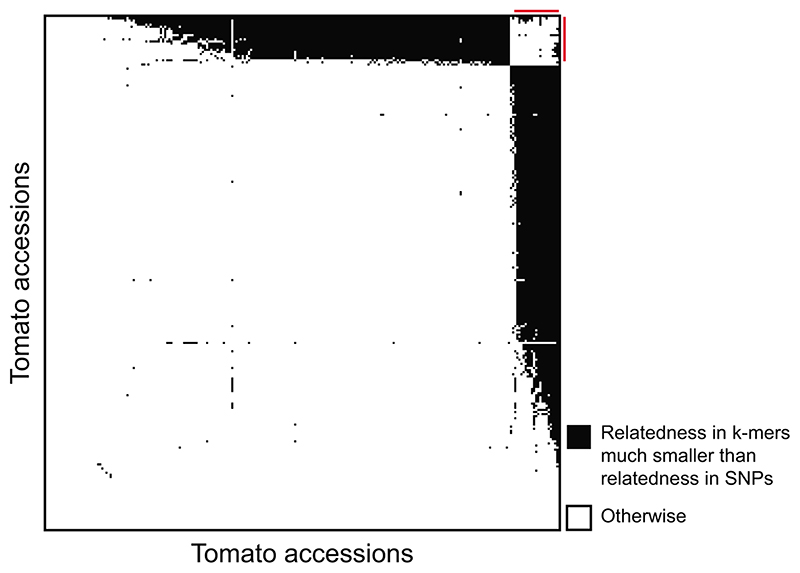
Extended Data Fig. 10. Kinship matrix calculation based on k-mers for tomato accessions.
Identification of pairs of tomato accessions for which relatedness as measured with k-mers is much lower than relatedness as measured with SNPs. For every pair among the 246 accessions, a black square is plotted if the difference in relatedness between SNPs and k-mers is larger than 0.15. Accessions are ordered by the number of black square in their row/column. Red lines mark the 21 accessions with most black squares, that is, those for which the k-mer/SNP difference in relatedness is larger than 0.15 for the most pairs.

