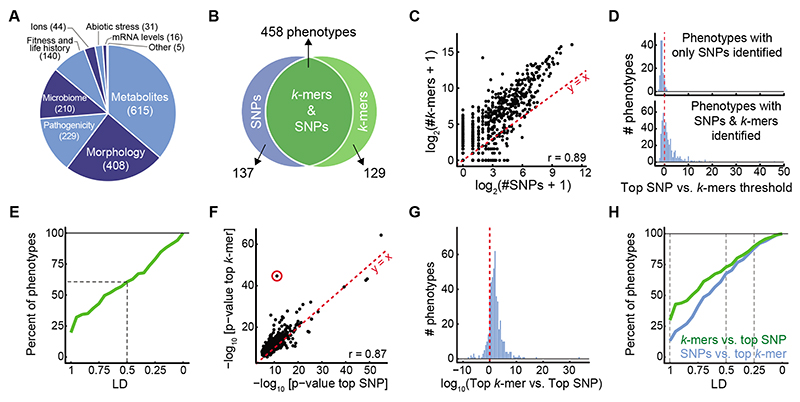
Figure 2. SNP- and k-mer-based GWAS on 1,582 A. thaliana phenotypes.
(A) Categories of collected phenotypes.
(B) Overlap between phenotypes with SNP and k-mer hits.
(C) Correlation of numbers of significant k-mers vs. SNPs.
(D) Ratios (in log10) of top SNP p-value vs. the k-mer threshold for 137 phenotypes with only significant SNPs (top), and for 458 phenotypes with both significant SNPs and k-mers (bottom).
(E) Fraction of phenotypes, from 137 phenotypes that had only significant SNP hits, for which a k-mer passing the SNP threshold could be found within different LD cutoffs. For a minimum of LD=0.5 (dashed lines), 61% of phenotypes had a linked k-mer that passed the SNP threshold.
(F) Correlation of p-values of top k-mers and SNPs (r=0.87). Red circle marks the strongest outlier (see Fig. 3A, B for details on this phenotype).
(G) Ratio between top p-values (expressed as -log10) in the two methods, for the 458 phenotypes with both k-mer and SNP hits.
(H) Fraction of all phenotypes for which a significant SNP could be found within different LD cutoffs of top k-mer (blue) and vice versa (green). Dashed lines mark LD=1, 0.5, and 0.25, with fractions of phenotypes being 29%, 73%, and 90% for the green curve, and 13%, 67%, and 88% for the blue curve, respectively.

