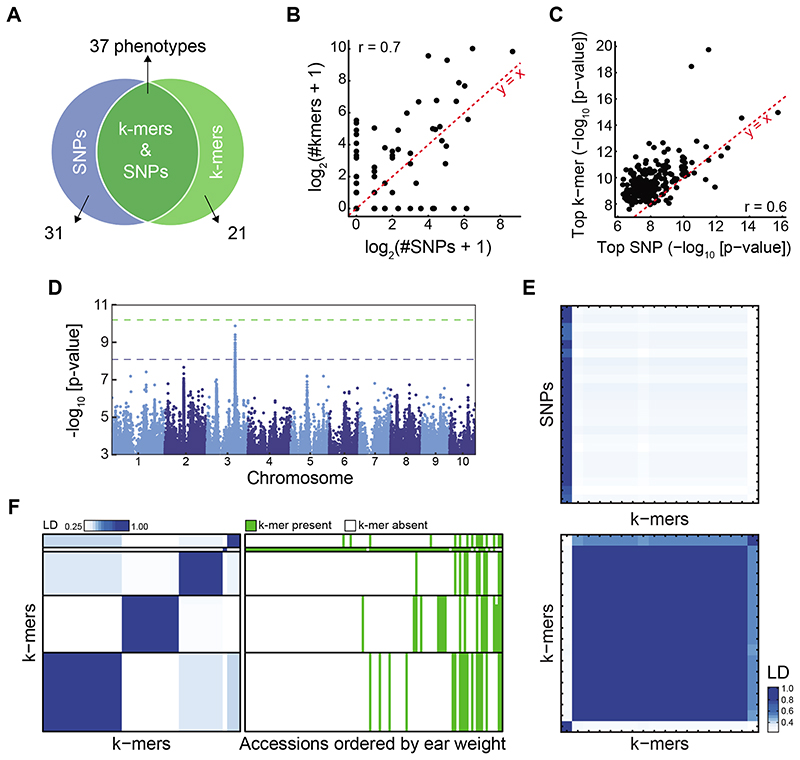
Figure 4. SNP- and k-mer-based GWAS in maize.
(A) Overlap between SNP and k-mer hits. See also Extended Data Fig. 8B,C.
(B) Correlation of numbers of significant k-mers vs. SNPs. See also Extended Data Fig. 8E.
(C) Correlation of p-values of top k-mers and SNPs.
(D) SNP associations with days to tassel (environment 06FL1).
(E) LD between 23 significant SNPs and 18 k-mers (top) or k-mers to k-mers (bottom) for days to tassel. Order of k-mers is the same in both heatmaps.
(F) LD between 45 k-mers associated with ear weight (environment 07A, left), and k-mer presence/absence patterns in different accessions ordered by their ear weight (right).

