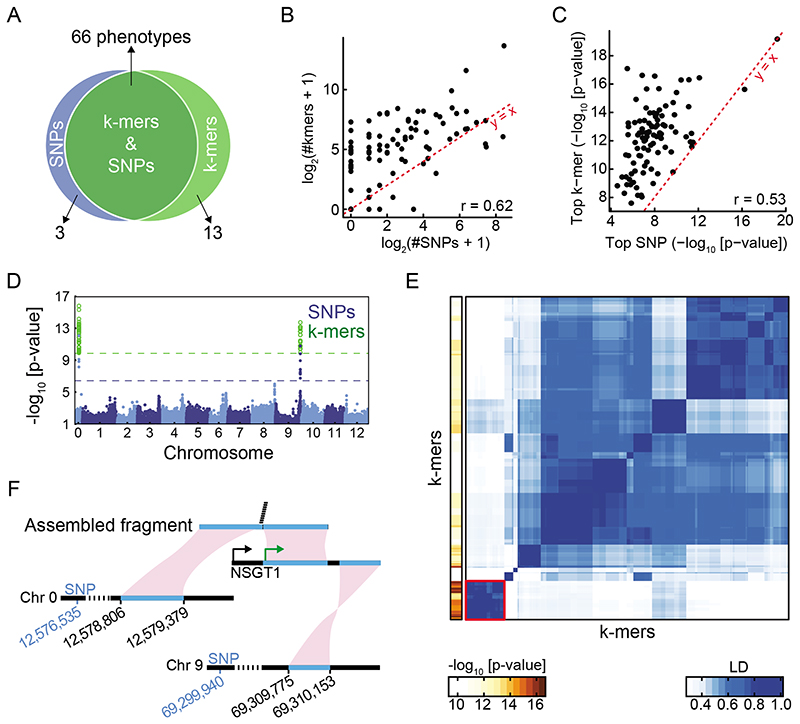
Figure 5. SNP- and k-mer-based GWAS in tomato.
(A) Overlap between SNP and k-mer hits. See also Extended Data Fig. 9B,C.
(B) Correlation of numbers of significant k-mers vs. SNPs. See also Extended Data Fig. 9E.
(C) Correlation of p-values of top k-mers and SNPs.
(D) SNP and k-mer associations with guaiacol concentration.
(E) LD among 293 k-mers associated with guaiacol concentration (right), and the p-value of each k-mer (left). Red square on bottom left indicates the 35 k-mers with lowest p-values and no mappings to the reference genome.
(F) Part of a fragment assembled from the 35 unmapped k-mers (E) mapped to chromosome 0 and another part to the unanchored complete NSGT1 gene from a non-reference accession. Only the 3’ end of NSGT1 is found in the reference genome, on chromosome 9. The green and black arrows mark the start of the NSGT1 ORF in the R104 “smoky” line and “non-smoky” lines33. The two significant SNPs closest to the two regions in the reference genome are indicated in blue.

