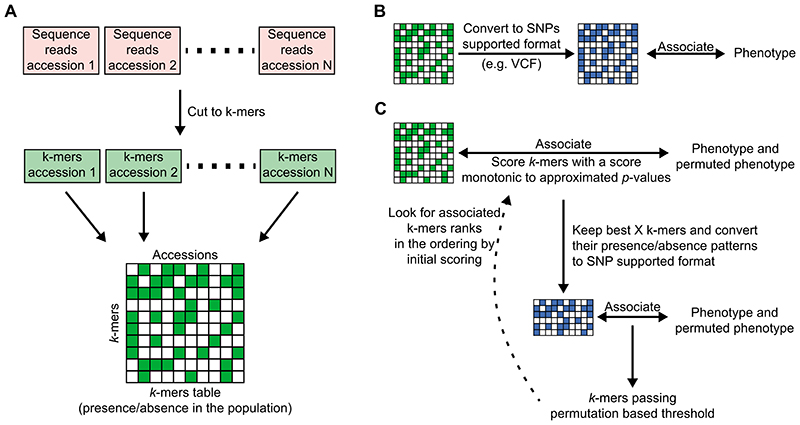
Extended Data Fig. 3. Pipeline for k-mer-based GWAS.
(A) Creating the k-mer presence/absence table: Each accession’s genomic DNA sequencing reads are cut into k-mers45, filtering k-mers appearing less than twice/thrice in a sequencing library. k-mers are further filtered to retain only those present in at least 5 accessions, and ones that are found in both forward and reverse-complement form in at least 20% of accessions they appeared in. All k-mer lists are combined into a k-mer presence/absence table.
(B) Genome-wide associations on the full k-mers table using SNP-based software: the k-mers table is converted into PLINK binary format, which is used as input for SNP-based association mapping software14,42.
(C) GWA optimized for the k-mers: k-mers presence/absence patterns are first associated with the phenotype and its permutations using a LMM to account for population structure16,17. This first step is done by calculating an approximated score of the exact model. Best k-mers from this first step (e.g. 100,000 k-mers) are passed to the second step, In which an exact p-value is calculated14 for both the phenotype and its permutations. A permutation-based threshold is calculated, and all k-mers passing this threshold are checked for their rank in the scoring from the first step. If not all k-mers hits are in the top 50% of the initial scoring, then the entire process is rerun from the beginning, passing more k-mers from the first to the second step. This last test is built to confirm that the approximation of the first step will not remove true associated k-mers.

